
I wanted to create a control panel for my home, so I decided to recycle an old tablet, host Home Assistant on my Docker engine, and connect my various devices through HACS or standard integrations.
Here is the final dashboard layout running on the tablet:
Setup & Architecture Overview
Instead of letting an older tablet gather dust, repurposing it as a dedicated touch terminal gives the entire home a single, responsive control interface without relying on proprietary, fragmented apps.
- Containerized Host: Deployed via Docker engine on local server hardware.
- Unified Integrations: Pulled devices together using native integrations alongside community components installed via HACS (Home Assistant Community Store).
- Tablet Kiosk: Configured to run full-screen displaying a clean 3-column Lovelace layout.
Dashboard Section Breakdown
The UI is divided into three intuitive columns optimized for a landscape tablet screen:
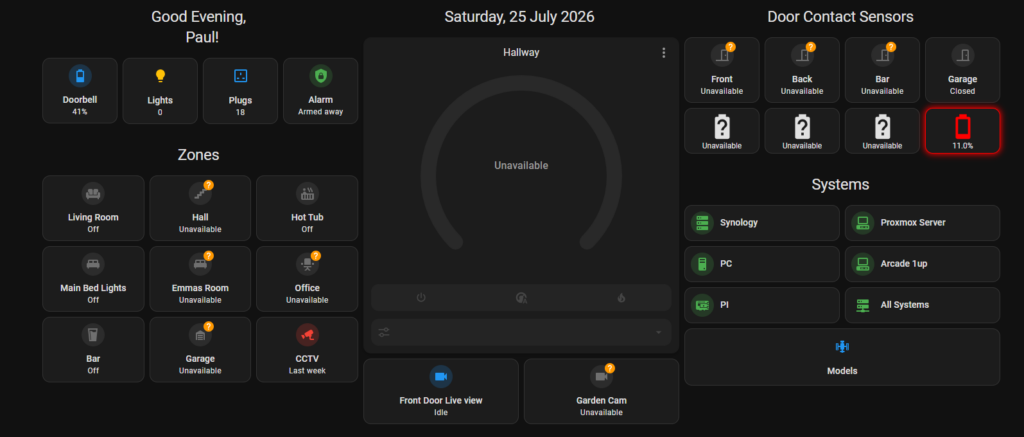
Left Column: Greeting, Quick Stats & Zones
- Greeting Header: Displays personal greeting (
Good Evening, Paul!). - Quick Stats: At-a-glance status chips for Doorbell battery, active Lights, Plug count, and Alarm system status.
- Zone Controls: Direct tiles for managing areas like Living Room, Hall, Hot Tub, Bedrooms, Office, Bar, Garage, and CCTV feeds.
Center Column: Primary Climate & Camera Streams
- Date Header: Shows current day and date status.
- Thermostat Control: Central circular gauge for adjusting the Hallway climate.
- Camera Feeds: Dedicated live preview tiles for the Front Door and Garden security streams.
Right Column: Door Sensors & System Infrastructure
- Door Contact Sensors: Contact monitoring for Front, Back, Bar, and Garage doors, paired with battery health indicators (e.g., triggering red warnings when low, such as 11%).
- Infrastructure Nodes: Hardware and node status tracking for local network devices including Synology, Proxmox Server, main PC, Arcade 1up, Raspberry Pi, and total system groups.
Dedicated Sub-View: Smart Model Lighting & Sound FX
Navigating from the main interface via the Models button opens a custom control board for interactive scale models and LEGO builds. Using custom microcontrollers (like ESP32s running ESPHome) paired with PWM LED controllers and audio triggers, each model gets tailored lighting effects and sound sequences:
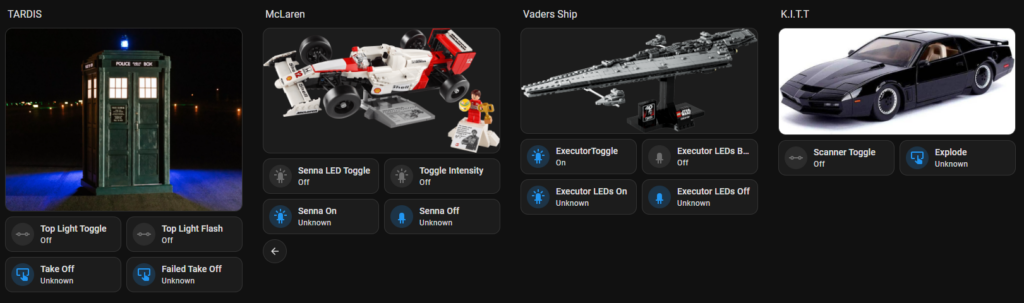
Display Models Grid Overview:
- TARDIS: Controls for the beacon light (
Top Light Toggle,Top Light Flash) alongside script triggers for sound and light sequences (Take Off,Failed Take Off). - McLaren (Ayrton Senna Lego Set): Headlight/underglow controls (
Senna LED Toggle,Toggle Intensity) and master power scripts (Senna On,Senna Off). - Vader’s Ship (Executor Super Star Destroyer): Engine and bridge lighting toggles (
ExecutorToggle,Executor LEDs B...) with rapid scene triggers (Executor LEDs On,Executor LEDs Off). - K.I.T.T. (Knight Rider): Controls for the signature front red scanner bar (
Scanner Toggle) and dynamic event triggers (Explode).
Infrastructure View: Synology DS224+ Monitoring
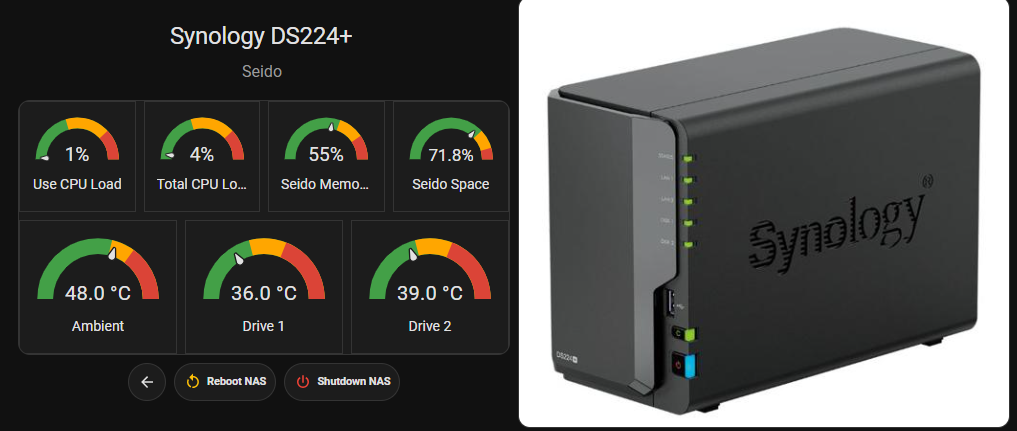
Tapping into the Synology button under the Systems panel opens a detailed hardware telemetry view for the NAS (“Seido”). Built using custom gauge cards (like canvas-gauge-card or custom ApexCharts via HACS), this screen gives immediate thermal and resource feedback:
Hardware Metrics Tracked:
- Resource Gauges: CPU Load, Total CPU Utilization, Memory Usage (55%), and Storage Space Usage (71.8%).
- Thermal Sensors: Ambient chassis temperature (48.0°C) alongside individual drive bay temperatures (Drive 1 at 36.0°C, Drive 2 at 39.0°C).
- Power Management Controls: Action buttons mapped to DSM SSH/API commands to safely
Reboot NASorShutdown NAS.
Infrastructure Overview: All Systems Command Center
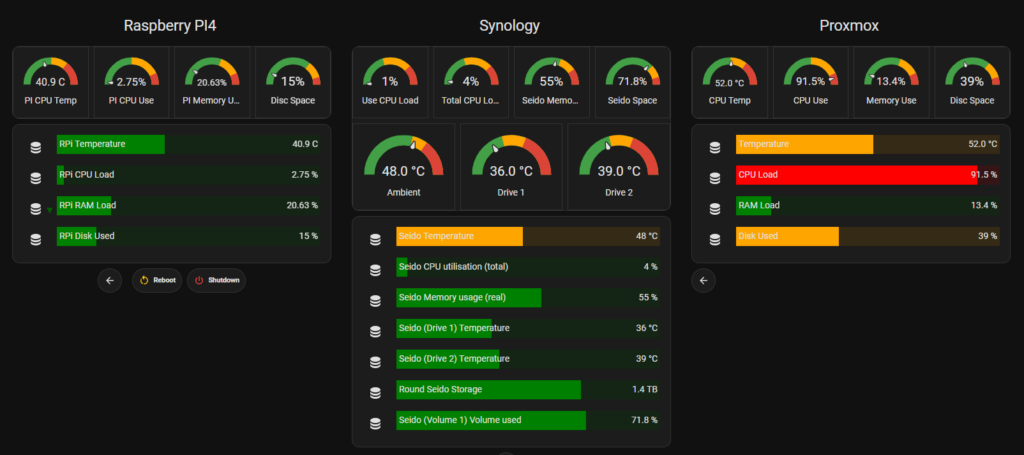
Clicking on the All Systems button brings up a comprehensive cluster monitoring dashboard. This view aggregates telemetry across primary homelab nodes—Raspberry Pi 4, Synology NAS (Seido), and Proxmox VE—into a single comparison grid with real-time gauges and linear progress bars.
Cluster Hardware Telemetry Breakdown:
- Raspberry Pi 4: Monitors CPU temperature (40.9°C), low CPU load (2.75%), RAM utilization (20.63%), and storage space used (15%). Includes quick-action
RebootandShutdowntriggers. - Synology NAS (Seido): Tracks CPU utilization, memory (55%), storage capacity (71.8% / 1.4 TB), chassis ambient temperature (48°C), and dual-drive thermals (36°C / 39°C).
- Proxmox Virtualization Host: Displays CPU core temperature (52.0°C), current CPU load spike (91.5% highlighted in red), low RAM usage (13.4%), and total storage space allocated (39%).