

Monitoring Realm Labs didn’t start as one big project.
Like most things in the home lab, it grew.
Initially, I just wanted to know whether a Raspberry Pi was getting hot.
Then I wanted to know what Proxmox was doing.
Then the Synology.
Then I started wondering whether the ports on my old HP ProCurve were actually negotiating at gigabit speed.
Eventually, I ended up with Home Assistant, Prometheus and Grafana all playing different roles in the same monitoring environment.
The result is a dashboard that gives me a surprisingly detailed picture of almost the entire lab from one screen.
Live Homelab Telemetry
Read-only live monitoring from the RealmLabs infrastructure.
What I like about this setup is that it isn’t just a collection of attractive graphs.
I can see:
- Whether individual switch ports are connected
- What speed they have negotiated
- Proxmox CPU, memory, swap, load and temperature
- Synology CPU and memory usage
- Disk temperatures
- Storage utilisation
- Raspberry Pi and Linux machine metrics
- Home Assistant metrics
- The health of the monitoring system itself
And because Prometheus stores the measurements over time, I can look backwards rather than only seeing what is happening right now.
Why Home Assistant, Prometheus and Grafana?
It would be reasonable to ask why I need three different platforms.
The answer is that they solve three different problems.
The simplest way I think about it is:
Prometheus
Collects and stores the metrics

Grafana
Turns those metrics into useful dashboards

Home Assistant
Turns states into something I can see, automate and act upon
There is some overlap, but I don’t consider that a problem.
If Proxmox starts running hot, Grafana is where I want to investigate its temperature over the previous few hours.
Home Assistant is where I might want:
Temperature > 75°C for 10 minutes
              |
              v
       Send notification
One is excellent for investigation.
The other is excellent for action.
The Realm Labs Monitoring Architecture
The monitoring setup currently looks roughly like this:
                       HP ProCurve
                           |
                          SNMP
                           |
                           v
                     SNMP Exporter
                         :9116
                           |
                           |
       +-------------------+-------------------+
       |                   |                   |
       v                   v                   v
    Proxmox            Linux Hosts       Home Assistant
 Node Exporter           Exporters       /api/prometheus
       |                   |                   |
       +-------------------+-------------------+
                           |
                           v
                      Prometheus
                           |
                       PromQL
                           |
                           v
                        Grafana
                           |
                           v
                 Realm Labs Dashboard
Home Assistant is slightly different because it is both part of the infrastructure being monitored and one of the systems I use to monitor everything else.
That gives me two useful views of the same environment.
Grafana gives me the engineering view.
Home Assistant gives me the operational view.
Prometheus: The Collector in the Middle
Prometheus sits between the devices and Grafana.
Its job is to periodically ask each monitored system:
What are your current metrics?
and then store the results as time-series data.
My global scrape interval is:
global:
  scrape_interval: 15s
So for most targets, Prometheus collects a fresh set of metrics every 15 seconds.
That’s frequent enough to give me useful graphs without being excessive for a home lab.
What Prometheus Is Actually Monitoring
The Targets page is one of the best places to understand the environment.
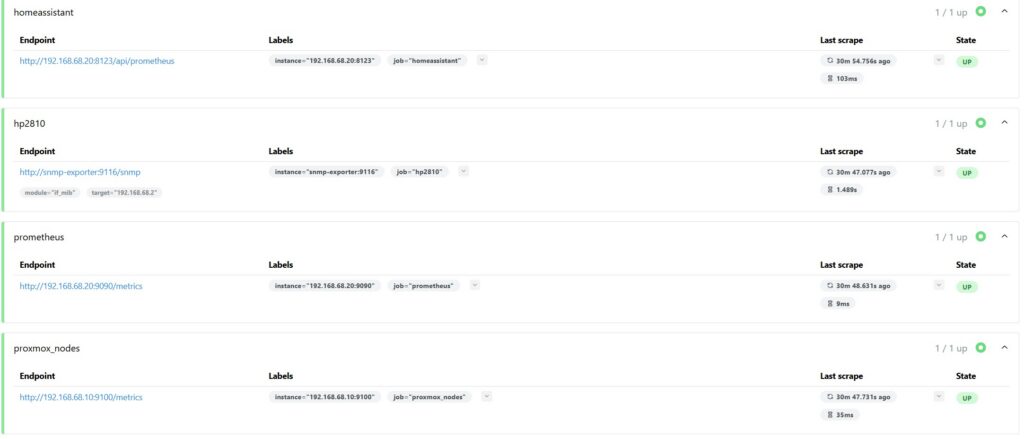
Several completely different platforms are feeding the same Prometheus database.
Among them are:
hp2810
prometheus
proxmox_nodes
Vaeternus
homeassistant
There are additional jobs for other Realm Labs systems as well.
The important part is that they don’t all expose their information in the same way.
Prometheus doesn’t care.
As long as the data eventually appears in Prometheus’ metrics format, it can be stored and queried in exactly the same way.
The Actual Prometheus Configuration
Here is the configuration from the current setup.
A simplified version looks like this:
global:
  scrape_interval: 15s

scrape_configs:

  - job_name: 'prometheus'
    static_configs:
      - targets:
          - 192.168.68.20:9090

  - job_name: 'hp2810'
    metrics_path: /snmp

    params:
      module:
        - if_mib

    static_configs:
      - targets:
          - 192.168.68.2

    relabel_configs:

      - source_labels:
          - __address__
        target_label: __param_target

      - source_labels:
          - __param_target
        target_label: instance

      - target_label: __address__
        replacement: snmp-exporter:9116

  - job_name: 'Vaeternus'
    static_configs:
      - targets:
          - 192.168.68.44:9182

  - job_name: 'proxmox_nodes'
    static_configs:
      - targets:
          - 192.168.68.10:9100

  - job_name: 'homeassistant'
    scrape_interval: 30s
    metrics_path: /api/prometheus

    authorization:
      credentials: REDACTED

    static_configs:
      - targets:
          - 192.168.68.20:8123
This demonstrates something I originally found slightly confusing about Prometheus.
A target does not necessarily mean Prometheus is talking directly to the target device.
The HP switch is a good example.
Monitoring an Old HP ProCurve with Modern Tools
My HP ProCurve is considerably older than the rest of the monitoring stack.
It certainly wasn’t designed with Prometheus in mind.
But it does support SNMP.
That is enough.
The path looks like this:
HP ProCurve
192.168.68.2
      |
      | SNMP
      v
SNMP Exporter
:9116
      |
      | Prometheus-compatible metrics
      v
Prometheus
      |
      v
Grafana
Prometheus is actually scraping:
http://snmp-exporter:9116/snmp
and supplying:
192.168.68.2
as the target the exporter should interrogate.
The if_mib module tells SNMP Exporter which collection of standard interface information I want.
That gives me metrics for things including:
- Interface state
- Interface description
- Interface speed
- Traffic
- Errors
- Counters
Suddenly a very old enterprise switch becomes an extremely useful source of modern monitoring data.
Turning SNMP Data into a Useful Port-Speed Display
The top of my Grafana dashboard shows the ports on the HP switch.
Rather than merely showing whether the port exists, I wanted each panel to show its active link speed.
The query for one of the ports looks like this:
The PromQL is:
max(ifHighSpeed{job="hp2810",ifDescr="1"})
*
(max(ifOperStatus{job="hp2810",ifDescr="1"}) == 1)
or vector(0)
This is more useful than displaying ifHighSpeed on its own.
What ifHighSpeed Gives Me
The metric:
ifHighSpeed
contains the interface’s reported speed.
For a gigabit connection, that may be:
1000 Mbps
That is useful.
But by itself there is a problem.
A disconnected interface is still a gigabit-capable interface.
I don’t want a disconnected port to appear as though it is currently operating at 1 Gbps.
Checking Whether the Port Is Actually Up
That’s where:
ifOperStatus
comes in.
An operational interface has the appropriate UP status.
So I combine:
Interface speed
      +
Operational status
to create the displayed value.
Conceptually:
1 Gbps interface + Port UP
            =
          1 Gbps
but:
1 Gbps interface + Port DOWN
            =
            0
The:
or vector(0)
also gives Grafana a sensible zero value where no useful result exists.
That means I can glance across the dashboard and immediately see the state of the physical network.
Giving Ports Useful Names
Raw interface numbers aren’t particularly interesting.
I don’t want a dashboard that only says:
Port 1
Port 2
Port 3
Port 4
I want to know what they actually connect to.
That is why the smaller switch panels use names such as:
LinKueiNode - Office Switch

Uplink
Tado
Xbox
Pi4
X55
PC
Dock
The current dashboard makes interesting behaviour immediately visible.
For example, some devices are showing:
1000 Mbps
while others are:
10 Mbps
and unused ports show:
0 Mbps
That means I don’t need to log into the switch merely to answer:
Has that device negotiated the link I expected?
The dashboard tells me.
The Bar Switch
The same idea is used for:
ChaosSwitch - Bar Switch
where the meaningful names include:
Uplink
Arcade
Sky
Deco
Again, this is far more useful than generic interface numbers.
One glance tells me whether the uplink and Deco Ethernet backhaul are present.
That became especially useful after previously discovering that the Deco mesh could silently fall back to Wi-Fi when the wired path disappeared.
Monitoring Proxmox
The Proxmox host is another important system in Realm Labs.
Unlike the HP switch, it is a Linux system, so collecting metrics is much more straightforward.
The target shown by Prometheus is:
192.168.68.10:9100
Port 9100 is the familiar location for Node Exporter metrics.
This gives Prometheus access to a huge range of Linux host information.
CPU.
Memory.
Swap.
Filesystem usage.
Load averages.
Network statistics.
And much more.
Calculating CPU Busy Percentage
One of my Grafana queries for Proxmox is:
The query is:
100 * (
  1 -
  avg(
    rate(
      node_cpu_seconds_total{
        mode="idle",
        instance="192.168.68.10:9100"
      }[$__rate_interval]
    )
  )
)
At first glance, that looks considerably more complicated than:
Show CPU percentage
but there is a reason.
Prometheus isn’t receiving a ready-made Windows Task Manager-style CPU number.
Instead, the metric:
node_cpu_seconds_total
tracks how much CPU time has accumulated in different states.
One of those states is:
mode="idle"
Why rate() Is Needed
The raw metric continuously increases.
What I’m interested in is how quickly it has changed during a period.
That’s what:
rate()
does.
So:
Cumulative idle CPU time
          |
          v
        rate()
          |
          v
Fraction of recent CPU time spent idle
Then:
1 - idle
gives me the portion of CPU time that wasn’t idle.
Multiply by 100 and I get a percentage suitable for the dashboard.
The Advantage of Seeing Several Metrics Together
At the moment captured in my dashboard, Proxmox was reporting approximately:
CPU Busy        19.5%
RAM Used        79.8%
Swap Used        0.9%
Load 1           0.17
Load 5           0.15
Temperature     54°C
Looking only at:
RAM: 79.8%
might make the machine look fairly heavily loaded.
But the surrounding measurements give context.
CPU utilisation is modest.
The load average is very low.
Swap is barely being used.
Temperature is reasonable.
That is why I like dashboards that combine related information instead of filling the screen with one enormous CPU graph.
Monitoring is more useful when it helps answer:
Is this behaviour actually a problem?
rather than simply presenting a number.
Monitoring the Synology DS224+
Seido, my Synology DS224+, has gradually become one of the most important machines in Realm Labs.
It handles things including:
- Storage
- Docker workloads
- DNS
- Directory services
- NFS
- SMB
- Backups
So it deserves monitoring.
The same main Grafana dashboard shows Synology CPU and memory alongside Proxmox.
At the time of the screenshot it was sitting around:
CPU              9%
Memory           52%
Temperature      47°C
I can also see the storage and physical disk temperatures:
HDD1             36°C
HDD2             37°C
This gives me a quick infrastructure health check without opening DSM.
Why Drive Temperature Is Useful
Hard-drive temperature isn’t normally something I sit and watch.
That’s exactly why it belongs on a dashboard.
Under normal conditions I learn what:
normal
looks like.
If one drive suddenly moves significantly away from the other, that becomes interesting.
For example:
HDD1     36°C
HDD2     55°C
would immediately stand out.
The value of monitoring isn’t always catching an obvious failure.
Sometimes it is recognising that something no longer looks normal.
Other Linux Systems
The same Grafana view includes:
Vaeternus
and additional hosts are defined in Prometheus, including systems such as:
Arcade1up
RacingSim
That is where the architecture starts becoming particularly useful.
Prometheus doesn’t care whether the metric originally came from:
- Proxmox
- A Raspberry Pi
- A Linux PC
- A NAS
- An HP switch
- Home Assistant
Once collected, they all become searchable time-series data.
Grafana can then bring those unrelated systems together on one dashboard.
Home Assistant Is Part of the Monitoring Stack Too
Home Assistant is where the monitoring setup becomes a little more interesting.
I don’t only use Home Assistant for:
Lights
Plugs
Doors
Heating
Cameras
My dashboard also includes infrastructure.
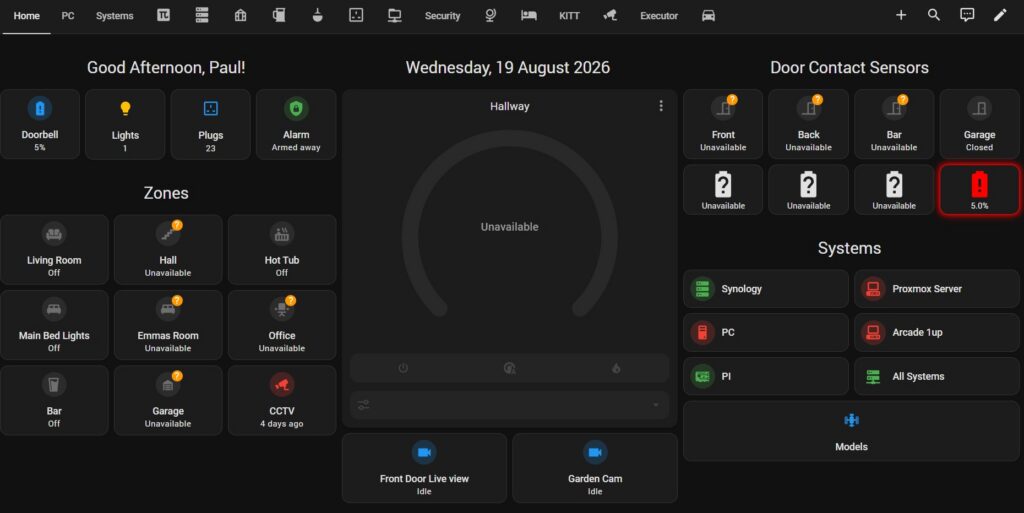
On the right-hand side I have a Systems area containing things such as:
Synology
Proxmox Server
PC
Arcade 1up
PI
All Systems
That gives me a much more operational view of the lab.
I don’t necessarily need to know that Proxmox is currently using 19.5% CPU.
I may only want to know:
Is Proxmox available?
That’s a different question.
Home Assistant vs Grafana
This is the distinction I find most useful.
Grafana answers:
What has this system been doing?
Home Assistant answers:
What state is this system in right now,
and should something happen because of it?
For example, Grafana is excellent for:
Show me the CPU temperature over seven days.
Home Assistant is excellent for:
If CPU temperature exceeds 75°C for ten minutes,
send me a notification.
I want both.
Unavailable Entities Are Useful Information
The Home Assistant screenshot also shows several entities currently reporting:
Unavailable
That isn’t something I would necessarily hide from a monitoring article.
It’s exactly the sort of information the dashboard is supposed to expose.
If something I expect to be available goes unavailable, Home Assistant makes that extremely obvious.
The next question is then:
Is the device offline?

Is the integration broken?

Is the network path down?

Has a battery died?

Has Home Assistant lost the entity?
Grafana or Prometheus can then provide more context if the affected device is also monitored there.
Prometheus Is Monitoring Home Assistant
Home Assistant isn’t only consuming infrastructure state.
It is also exposing metrics back to Prometheus.
The current Prometheus target is:
http://192.168.68.20:8123/api/prometheus
That means the architecture also contains:
Home Assistant
      |
      | Prometheus metrics
      v
Prometheus
      |
      v
Grafana
Prometheus authenticates to Home Assistant and periodically scrapes the metrics endpoint.
My Home Assistant scrape interval is currently:
scrape_interval: 30s
rather than the global 15-second interval.
There is no real reason for me to scrape every Home Assistant entity extremely aggressively.
Thirty seconds is more than adequate for the sort of monitoring I’m doing.
Keep the Token Secret
The Prometheus job needs authentication.
My configuration uses:
authorization:
  credentials: <TOKEN>
That token should be treated like a password.
It should never appear in:
- Public screenshots
- GitHub repositories
- Blog posts
- Public Compose files
The version shown in this article is deliberately redacted.
Where Prometheus and Grafana Store Their Data
Containers are very easy to recreate.
The data they contain can be much more valuable.
My monitoring data lives on persistent storage backed by the Synology rather than being something I want tied permanently to the lifecycle of a single container.
This follows the same rule I use across most of my container environment:
Container
   =
Disposable

Configuration / Data
   =
Persistent
Conceptually:
Prometheus Container
        |
        v
Persistent data directory
        |
        v
Synology storage
and:
Grafana Container
        |
        v
Grafana configuration/data
        |
        v
Synology storage
That means recreating the application container doesn’t have to mean recreating the monitoring environment from scratch.
Why This Matters for Prometheus
Prometheus is a time-series database.
The historic data is one of the main reasons I use it.
If every container update deleted the metric history, I’d lose a large part of the benefit.
Persistent storage means I can rebuild the container while keeping the collected data available.
The same principle applies to Grafana.
I want dashboards and configuration to survive the container.
Building a Grafana Panel from Scratch
Once a Prometheus target is working, my normal process for adding something to Grafana is fairly straightforward.
Step 1: Confirm the Target Is Up
Prometheus Targets should show:
UP
If the target is down, I don’t touch Grafana yet.
Grafana cannot visualise metrics Prometheus hasn’t collected.
Step 2: Query the Metric in Prometheus
Before building a panel, I find the raw metric.
For SNMP that might be:
ifOperStatus
or:
ifHighSpeed
For Linux:
node_cpu_seconds_total
The goal is to establish:
Does the data actually exist?
Step 3: Narrow the Labels
Prometheus metrics often contain many instances.
So I narrow the result using labels.
For example:
ifHighSpeed{
  job="hp2810",
  ifDescr="1"
}
Now I know I’m looking at:
HP 2810
Interface 1
rather than every interface from every monitored device.
Step 4: Turn Raw Data into Meaning
The raw metric is not always the number I want.
That is where PromQL becomes powerful.
For the switch I combine:
Link capability
+
Current operational state
For CPU I calculate:
1 - idle CPU
This creates the number I actually care about.
Step 5: Build the Grafana Visualisation
Only then do I decide whether the result belongs as:
- Gauge
- Bar gauge
- Stat
- Time series
- Table
- State timeline
The dashboard should follow the question.
Not the other way around.
My Approach to Dashboard Design
I don’t try to put every metric Prometheus knows onto the dashboard.
That would be unreadable.
Instead I think in terms of:
What would I want to know quickly if something was wrong?
For the core switch:
Are the important ports connected?
At what speed?
For Proxmox:
CPU
RAM
Swap
Load
Temperature
For Synology:
CPU
RAM
Storage
Temperature
Drive temperatures
For storage:
How full is it?
Those are the things that deserve space on the overview.
If something looks unusual, I can drill further into Prometheus or a more detailed Grafana dashboard.
Home Assistant as the Action Layer
Prometheus and Grafana can tell me a huge amount.
But Home Assistant lets me turn infrastructure state into automation.
A simple example might be:
Raspberry Pi Temperature
          |
          v
       > 75°C
          |
      for 10 min
          |
          v
Home Assistant Notification
Or:
Important Server
      |
      v
Unavailable
      |
      v
Wait 5 minutes
      |
      v
Send Notification
The precise automation isn’t important.
The point is that monitoring becomes more useful when something can act on it.
Seeing History Changes Troubleshooting
This is probably the most important difference between monitoring and simply checking a status page.
Without historic data:
The network feels slow.
I can check it now.
Maybe everything looks normal.
With Prometheus:
When did it become slow?
becomes something I can actually investigate.
For example:
13:00  Normal
14:00  Interface changes
14:05  Throughput drops
14:10  User notices problem
Now I have context.
The same applies to:
- Temperature
- Memory
- CPU
- Disk space
- Interface errors
- Network traffic
Historical visibility turns:
It feels wrong.
into:
Something changed here.
That’s far more useful.
Adding a New Device
Once the basic monitoring environment exists, adding another machine is much easier than building the whole stack again.
My general process is:
1. Decide what data the device can expose
2. Install/configure the appropriate exporter
3. Add the Prometheus scrape job
4. Reload Prometheus
5. Check Targets
6. Find useful metrics
7. Write PromQL
8. Build Grafana panels
9. Add Home Assistant visibility/automation if useful
The exporter depends on the device.
A Linux machine might expose:
Node Exporter
A network switch might use:
SNMP Exporter
Home Assistant provides:
/api/prometheus
The source changes.
The rest of the monitoring workflow stays remarkably similar.
Why Exporters Are Such an Important Concept
Prometheus works beautifully when an application already exposes Prometheus-format metrics.
But plenty of useful equipment doesn’t.
That’s where exporters come in.
They translate.
For the HP switch:
Old-world SNMP
       |
       v
SNMP Exporter
       |
       v
Modern Prometheus metrics
That is why equipment from a completely different generation can sit alongside Proxmox and Home Assistant on the same Grafana screen.
Prometheus doesn’t need every manufacturer to redesign its equipment.
It just needs something capable of translating the measurements.
What About Uptime Kuma?
I also use Uptime Kuma in Realm Labs.
I don’t see that as replacing this stack either.
Uptime Kuma answers the very simple question:
Is it up?
Prometheus and Grafana answer:
What is it doing?
Home Assistant answers:
What should I do about it?
That gives me a monitoring model I actually find useful:
Uptime Kuma
Availability

Prometheus
Metrics

Grafana
Analysis and visualisation

Home Assistant
Operational state and automation
Each tool has a fairly clear job.
What This Dashboard Has Already Taught Me
One of the more interesting benefits is simply becoming familiar with what normal looks like.
I now know approximately where:
Proxmox RAM
Synology temperature
Switch CPU
Disk temperatures
System load
normally sit.
That means an unusual reading stands out far more quickly.
This is something dashboards do particularly well.
You’re not necessarily staring at exact numbers every day.
You become familiar with the shape of the system.
What I’d Improve Next
The monitoring environment will probably continue to evolve.
There are a few areas I can already see myself expanding.
Better Alerting
I don’t want hundreds of notifications.
But I do want meaningful alerts for things such as:
Disk nearly full
Sustained high temperature
Critical device unavailable
Unexpected link-speed change
Backup not completed
The important word is sustained.
One CPU spike is not an emergency.
More Network Data
The HP switch is already giving me useful interface information.
Traffic rates, errors and dropped packets would make the network view even more useful.
Then a port could tell me not only:
I'm connected at 1 Gbps
but:
This is how much traffic I'm actually carrying.
Better Cross-Linking Between Dashboards
The overview should stay clean.
Where something looks wrong, I want to be able to jump into a more detailed dashboard for that system.
For example:
Realm Labs Overview
       |
       v
Click Proxmox
       |
       v
Detailed Proxmox Dashboard
That is preferable to putting every possible measurement on one page.
Was It Worth Building?
Definitely.
This setup went well beyond my original objective.
I started wanting to know whether a few machines were healthy.
I ended up with:
Network
Servers
Storage
Home Automation
Virtualisation
Linux
NAS
all visible through a common monitoring platform.
And because the data lives in Prometheus, I’m not limited to whatever dashboard the manufacturer happened to provide.
I can ask my own questions.
The Realm Labs Takeaway
The biggest lesson from building the monitoring environment is that there isn’t one perfect monitoring application.
The setup works because the different components do different jobs.
Prometheus gives me:
Collection
History
Time-series data
PromQL
Grafana gives me:
Dashboards
Visualisation
Correlation
Investigation
Home Assistant gives me:
Current state
Device awareness
Notifications
Automation
And SNMP Exporter lets older equipment join the party.
The full path looks something like:
                   Realm Labs Infrastructure
                            |
       +--------------------+--------------------+
       |                    |                    |
       v                    v                    v
  HP ProCurve            Proxmox          Home Assistant
       |                    |                    |
      SNMP             Node Exporter       Prometheus API
       |                    |                    |
       v                    |                    |
 SNMP Exporter              |                    |
       |                    |                    |
       +--------------------+--------------------+
                            |
                            v
                       Prometheus
                            |
                            v
                         Grafana
                            |
                            v
                 Infrastructure Dashboard


                       Home Assistant
                            |
                            v
                 States / Alerts / Actions
What I particularly like is that none of this requires particularly exotic hardware.
An old HP switch.
A small Proxmox host.
A Synology NAS.
A few Raspberry Pis and Linux machines.
Home Assistant.
And some open-source monitoring software.
Put them together, and I can see more about what Realm Labs is doing than I ever could by logging into each device individually.
The dashboard isn’t the clever bit.
The useful part is the data underneath it.
Because the next time something behaves strangely, I don’t have to start with:
I wonder what's wrong?
I can start with:
Let's see what changed.