
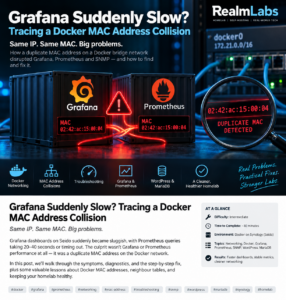

Grafana had been behaving strangely for a few days. Dashboards that used to appear almost instantly were taking seconds to populate, some panels sat spinning, and occasionally a query would fail completely.
The obvious suspects were Grafana itself, Prometheus, the Synology NAS hosting the containers, or one of the dashboards sending an expensive PromQL query. None of those turned out to be the real problem.
The fault was lower down the stack: two Docker containers on the same bridge network had ended up with the same MAC address.
Lab note: this was found on my Synology-hosted monitoring stack, with Grafana and Prometheus managed through Portainer. The same troubleshooting process applies to normal Docker Compose deployments too.
The symptom: Grafana looked slow, but the host was not busy
The first check was container utilisation:
sudo docker stats --no-stream grafana prometheusGrafana was using only a few hundred megabytes of RAM and a couple of percent CPU. Prometheus was even lighter. There was no obvious CPU, memory or disk pressure.
The Grafana logs were more interesting. Prometheus requests were completing, but response times were all over the place: some below a second, others taking 10–20 seconds, and one eventually failing after Grafana’s 30-second timeout.
This mattered because it separated Grafana rendering slowly from Grafana waiting for its datasource. My wider monitoring setup is documented in Monitoring My Entire Home Lab with Home Assistant, Prometheus and Grafana.
Prometheus itself was fast
From the Synology host, the same simple Prometheus query was effectively instant:
time curl -s "http://127.0.0.1:9090/api/v1/query?query=up" > /dev/null

time curl -s "http://192.168.68.20:9090/api/v1/query?query=up" > /dev/null
Typical results were around 14–42 ms. That suggested Prometheus itself was healthy.
Then I ran the equivalent query from inside the Grafana container:
sudo docker exec -it grafana sh

time wget -qO- "http://192.168.68.20:9090/api/v1/query?query=up" > /dev/null
The results were completely different:
2.46 seconds
Connection reset by peer
40.11 seconds
That was the turning point. The problem was not Prometheus query complexity; it was the network path from the Grafana container.
Testing Docker’s internal DNS exposed the real fault
Grafana and Prometheus were already attached to the same Compose network, so the cleaner path should have been:
http://prometheus:9090Docker DNS resolved the hostname correctly, but attempts to use it failed:
wget: can't connect to remote host (172.21.0.4): Host is unreachableThat should not happen between two healthy containers on the same bridge.
I inspected the network:
sudo docker network inspect grafana_defaultThe result immediately showed something wrong:
grafana
IP:  172.21.0.2
MAC: 02:42:ac:15:00:04

prometheus
IP:  172.21.0.4
MAC: 02:42:ac:15:00:04
Both containers had the same live MAC address.
Why the collision happened
Prometheus had no configured MAC address, so Docker was assigning one automatically. Grafana was different:
sudo docker inspect grafana --format 'MAC={{.Config.MacAddress}} NetworkMode={{.HostConfig.NetworkMode}}'That returned:
MAC=02:42:ac:15:00:04 NetworkMode=grafana_defaultGrafana had a manually configured MAC address. Prometheus had later been recreated and received an address that resulted in the same live MAC on that Docker network.
This explains why the setup could work for months and then apparently fail “out of nowhere”. The bad Grafana setting was dormant until another endpoint collided with it.
Portainer is extremely useful in my lab — I covered why in Docker Is the Engine, Portainer Is the Dashboard — but this was also a good reminder to distinguish between a container’s current runtime MAC and an explicitly configured MAC.
The fix
In Portainer I edited/recreated the Grafana container and cleared the editable MAC Address field, leaving the network, volumes, ports and environment variables untouched.
After recreation:
sudo docker inspect grafana --format 'MAC={{.Config.MacAddress}}'returned:
MAC=and the live network details now showed a unique address:
Grafana:
172.21.0.2
02:42:ac:15:00:02

Prometheus:
172.21.0.4
02:42:ac:15:00:04
The same internal query that had taken up to 40 seconds now completed immediately:
sudo docker exec grafana sh -c 'time wget -qO- "http://prometheus:9090/api/v1/query?query=up" >/dev/null'real 0m 0.00sThat was the practical confirmation that the underlying network fault was gone.
Audit the rest of the Docker estate
Once one manually pinned MAC had caused trouble, it made sense to check every running container.
for c in $(sudo docker ps -q); do
  name=$(sudo docker inspect --format '{{.Name}}' "$c" | sed 's#^/##')
  mac=$(sudo docker inspect --format '{{.Config.MacAddress}}' "$c")
  if [ -n "$mac" ]; then
    echo "$name | configured=$mac"
  fi
done
That found several other containers with configured MAC addresses, including WordPress, MariaDB and SNMP Exporter.
The important distinction is:
- Configured MAC:
.Config.MacAddress— manually pinned and worth reviewing. - Live MAC:
.NetworkSettings.Networks.*.MacAddress— normal; Docker needs a runtime MAC for bridge networking.
I removed the remaining unnecessary configured MACs one container at a time.
Be careful with stateful containers
Before recreating WordPress or MariaDB, I verified that their important data lived outside the containers:
sudo docker inspect wordpress --format '{{json .Mounts}}'
sudo docker inspect mariadb --format '{{json .Mounts}}'
In my setup:
WordPress:
 /volume1/Sektor/nfs/docker-volumes/wordpress
 -> /var/www/html

MariaDB:
 /volume1/Sektor/nfs/docker-volumes/mariadb
 -> /var/lib/mysql
That meant the containers could safely be recreated without deleting the site or database, provided those bind mounts stayed unchanged. If you are doing the same job on a production or important service, verify your storage before touching the container.
For more background on how I use Docker storage on the Synology side, see Building the Storage Backbone of Realm Labs.
A second issue appeared: stale neighbour data
After recreating SNMP Exporter with its MAC set back to automatic, Prometheus suddenly reported the exporter as down.
The new exporter was healthy:
IP:  172.21.0.3
MAC: 02:42:ac:15:00:03
but Prometheus still had the old MAC cached:
sudo docker exec prometheus ip neigh172.21.0.3 dev eth0 lladdr 02:42:ac:11:00:03 REACHABLESo Prometheus was sending traffic to an address that no longer belonged to the exporter.
Restarting Prometheus cleared the stale neighbour entry:
sudo docker restart prometheusSNMP scraping immediately recovered.
Useful lesson: if you recreate a container but keep the same IP while its MAC changes, another long-running container may temporarily retain the old neighbour mapping. If connectivity suddenly fails immediately after the change, inspect
ip neighbefore assuming the new container is broken.
Final checks
After cleaning the remaining pinned MACs, I reran the audit and got no output:
for c in $(sudo docker ps -q); do
  name=$(sudo docker inspect --format '{{.Name}}' "$c" | sed 's#^/##')
  mac=$(sudo docker inspect --format '{{.Config.MacAddress}}' "$c")
  if [ -n "$mac" ]; then
    echo "$name | configured=$mac"
  fi
done
That confirmed there were no manually configured MAC addresses left on the running containers.
WordPress and MariaDB were also tested after recreation:
curl -I http://127.0.0.1:8082which returned a normal HTTP/1.1 200 OK.
What I would check first next time
If a Docker-hosted application suddenly becomes intermittently slow while the host itself looks healthy, I would now add bridge-network health much earlier in the troubleshooting process:
- Compare host-to-service and container-to-service response times.
- Test the service by Docker DNS name rather than through the host’s published port.
- Inspect the Docker network for duplicate MAC addresses.
- Check
.Config.MacAddressfor manually pinned values. - After changing a container MAC, inspect
ip neighon long-running peers if connectivity remains strange.
The interesting part of this fault was how convincing the wrong diagnosis looked. Grafana appeared slow. Prometheus appeared occasionally slow. The dashboards appeared to be the problem. In reality, the monitoring applications were mostly innocent; the packets simply were not travelling reliably between their containers.
If you are building a similar monitoring stack, my earlier Centralised Homelab Monitoring with Prometheus and Grafana article covers the baseline deployment, while Updating Portainer Without Losing Your Containers covers safer container-management housekeeping.