
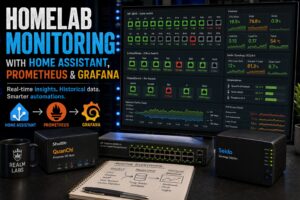

Monitoring started out fairly simply in Realm Labs.
At first, checking system health meant opening the individual management interface for whatever device I wanted to inspect.
Proxmox had one dashboard.
Synology had another.
Windows had Task Manager.
Home Assistant had its own sensors.
The network switches had SNMP data.
Raspberry Pi devices had to be checked over SSH.
That works when there are only a few systems, but it becomes increasingly awkward as the lab grows.
Prometheus and Grafana solved that by giving me one central monitoring layer for the wider environment.
Today, metrics from Linux, Windows, Home Assistant, network switches, Synology and other services all end up in Prometheus, with Grafana providing the visual layer.
The Realm Labs Monitoring Architecture
The current setup looks roughly like this:
Linux / Proxmox
      |
      | Node Exporter
      v

Windows Systems
      |
      | Windows Exporter
      v

HP Network Switch
      |
      | SNMP
      v
SNMP Exporter

Home Assistant
      |
      | /api/prometheus
      v

Custom Exporters
      |
      v
   Prometheus
      |
      v
    Grafana
      |
      v
  NetherRealm
The important part is that Prometheus provides the common data layer.
Grafana does not need to understand how every device works.
It only needs to query Prometheus.
Why Prometheus?
Prometheus works well in a homelab because most monitoring agents expose metrics through simple HTTP endpoints.
Prometheus periodically scrapes those endpoints and stores the values as time-series data.
For example, a Linux host running Node Exporter may expose metrics on:
192.168.68.10:9100Windows Exporter commonly uses:
192.168.68.x:9182Home Assistant exposes Prometheus metrics through:
/api/prometheusPrometheus then collects those values at regular intervals.
My global scrape interval is currently:
global:
  scrape_interval: 15s
That gives enough resolution for the infrastructure dashboards without generating unnecessary amounts of data.
Why Grafana?
Prometheus is excellent at storing and querying metrics.
Grafana is much better at displaying them.
Grafana provides:
- time-series graphs
- gauges
- bar gauges
- status panels
- tables
- thresholds
- variables
- historical views
- dashboard filtering
That allows metrics from completely different systems to appear together.
Instead of thinking in terms of:
Proxmox dashboard
Synology dashboard
Windows dashboard
Switch dashboard
I can think in terms of:
CPU
Memory
Storage
Network
Temperature
Availability
across the whole environment.
The Realm Labs Prometheus Configuration
The main Prometheus configuration lives in:
prometheus.ymlThe current configuration contains jobs for Prometheus itself, Linux hosts, Windows systems, the HP switch, Home Assistant and custom services.
A sanitised version looks like this:
global:
  scrape_interval: 15s

scrape_configs:

  - job_name: 'prometheus'
    static_configs:
      - targets:
          - '192.168.68.20:9090'


  - job_name: 'hp2510_system'
    metrics_path: /snmp

    params:
      module:
        - hp_custom

    static_configs:
      - targets:
          - 192.168.68.2

    relabel_configs:
      - source_labels:
          - __address__
        target_label: __param_target

      - source_labels:
          - __param_target
        target_label: instance

      - target_label: __address__
        replacement: snmp-exporter:9116


  - job_name: 'hp2810'
    metrics_path: /snmp

    params:
      module:
        - if_mib

    static_configs:
      - targets:
          - 192.168.68.2

    relabel_configs:
      - source_labels:
          - __address__
        target_label: __param_target

      - target_label: __address__
        replacement: snmp-exporter:9116


  - job_name: 'Arcade1up'
    static_configs:
      - targets:
          - 192.168.68.45:9182


  - job_name: 'RacingSim'
    static_configs:
      - targets:
          - 192.168.68.46:8085


  - job_name: 'Vaeternus'
    static_configs:
      - targets:
          - 192.168.68.44:9182


  - job_name: 'proxmox_nodes'
    static_configs:
      - targets:
          - '192.168.68.10:9100'


  - job_name: 'homeassistant'
    scrape_interval: 30s
    metrics_path: /api/prometheus

    authorization:
      credentials: YOUR_HOME_ASSISTANT_LONG_LIVED_TOKEN

    static_configs:
      - targets:
          - 192.168.68.20:8123
The credentials shown above are placeholders. Any real token used on the live system should stay private.
Monitoring Prometheus Itself
Prometheus can monitor its own endpoint:
- job_name: 'prometheus'
  static_configs:
    - targets:
        - '192.168.68.20:9090'
That might sound circular, but monitoring the monitoring system is useful.
If Prometheus itself starts struggling, I still want to see it.
Monitoring Proxmox with Node Exporter
The Proxmox host is scraped through Node Exporter:
- job_name: 'proxmox_nodes'
  static_configs:
    - targets:
        - '192.168.68.10:9100'
This provides Linux metrics such as:
- CPU usage
- memory
- swap
- filesystems
- disk I/O
- networking
- process activity
- hardware temperatures
- kernel statistics
The main Realm Labs Proxmox host is QuanChi, so this provides a detailed view of the physical system underneath the containers and virtual machines.
Monitoring Windows
Windows systems use Windows Exporter.
For example:
- job_name: 'Arcade1up'
  static_configs:
    - targets:
        - 192.168.68.45:9182
and:
- job_name: 'Vaeternus'
  static_configs:
    - targets:
        - 192.168.68.44:9182
Windows Exporter exposes metrics including:
- CPU
- memory
- storage
- network activity
- operating system information
Grafana can then query those values alongside the Linux systems.
Monitoring the HP Switch with SNMP Exporter
The network switch does not expose Prometheus metrics directly.
Instead, Prometheus sends the target to SNMP Exporter.
The flow is:
HP Switch
   |
   | SNMP
   v
SNMP Exporter
   |
   v
Prometheus
For interface monitoring, the Prometheus job uses:
- job_name: 'hp2810'
  metrics_path: /snmp

  params:
    module:
      - if_mib

  static_configs:
    - targets:
        - 192.168.68.2

  relabel_configs:
    - source_labels:
        - __address__
      target_label: __param_target

    - target_label: __address__
      replacement: snmp-exporter:9116
This provides access to information such as:
- port state
- interface speed
- traffic counters
- errors
- link status
That data feeds the switch-port views used in the Realm Labs monitoring dashboard.
Monitoring Home Assistant
Home Assistant can expose its entity data directly in Prometheus format.
First enable the integration in:
configuration.yamlwith:
prometheus:After restarting Home Assistant, metrics are available at:
/api/prometheusPrometheus then needs permission to read that endpoint.
Creating a Home Assistant API Token
In Home Assistant, open your user profile and scroll down to Long-Lived Access Tokens.
Create a new token and give it a descriptive name such as:
PrometheusCopy the token when Home Assistant displays it.
The token is then added to the Prometheus job:
- job_name: 'homeassistant'

  scrape_interval: 30s

  metrics_path: /api/prometheus

  authorization:
    credentials: YOUR_HOME_ASSISTANT_LONG_LIVED_TOKEN

  static_configs:
    - targets:
        - 192.168.68.20:8123
Do not publish the real value.
If a token is ever exposed publicly, revoke it and create a new one.
Why Home Assistant Is Useful as a Metrics Source
Not everything in Realm Labs has a native Prometheus exporter.
Home Assistant already knows about a large number of devices and systems, so its Prometheus endpoint becomes a useful bridge.
For example, NetherRealm uses Home Assistant data for Synology metrics.
The five-minute load from Seido is queried with:
homeassistant_sensor_unit_load{
  entity="sensor.seido_cpu_load_average_5_min"
}
NAS storage usage uses:
homeassistant_sensor_unit_percent{
  entity="sensor.seido_volume_1_volume_used"
}
And swap usage can be calculated from two Home Assistant values:
max(
  homeassistant_sensor_data_size_mb{
    entity="sensor.seido_memory_total_swap"
  }
)
-
max(
  homeassistant_sensor_data_size_mb{
    entity="sensor.seido_memory_available_swap"
  }
)
That allows Grafana to combine Home Assistant data with native Prometheus exporters in the same dashboard.
Validating the Prometheus Configuration
Before restarting Prometheus, I prefer checking the configuration.
If promtool is available:
promtool check config prometheus.ymlA valid configuration should report:
SUCCESSThis is much better than discovering an indentation problem after Prometheus refuses to start.
Restart Prometheus
If Prometheus is running as a service:
sudo systemctl restart prometheusIf it is running in Docker:
docker restart prometheusThen open the Prometheus interface and go to:
Status
   |
Targets
Each configured job should show:
UPTroubleshooting a Down Target
If a target shows:
DOWNthe Targets page normally gives the reason.
Typical causes include:
- incorrect IP address
- wrong port
- exporter not running
- firewall problem
- bad authentication
- incorrect metrics path
- Docker networking issue
- invalid Home Assistant token
This is usually the first place I check.
Testing Home Assistant Directly
If Prometheus cannot scrape Home Assistant, test the endpoint manually:
curl \
  -H "Authorization: Bearer YOUR_TOKEN" \
  http://192.168.68.20:8123/api/prometheus
If authentication and the Home Assistant Prometheus integration are working, metrics should be returned.
Adding Prometheus to Grafana
Once Prometheus is collecting data, add it as a Grafana data source.
In Grafana:
Connections
    |
Data Sources
    |
Add Data Source
    |
Prometheus
If Grafana and Prometheus share a Docker network, the address may be:
http://prometheus:9090Across the normal LAN, it may instead be:
http://192.168.68.20:9090Then select:
Save & TestThe NetherRealm Dashboard
The main Grafana dashboard is called NetherRealm.
It started relatively simply, but it has grown into a much deeper infrastructure dashboard.
The exported dashboard contains panels for:
- CPU cores
- uptime
- memory
- swap
- disk utilisation
- disk IOPS
- filesystem usage
- TCP errors
- UDP errors
- ICMP traffic
- network drops
- carrier errors
- frame errors
- multicast
- socket usage
- ARP entries
- hardware temperature
- time synchronisation
- exporter scrape health
- process forks
- memory page faults
- memory writeback
- active and inactive memory
- huge pages
- kernel memory
So the dashboard is no longer just:
CPU
RAM
Disk
It provides enough depth to actually diagnose problems.
Using Dashboard Variables
Many NetherRealm panels use variables such as:
$node
$job
instead of hard-coding every query to one host.
For example:
irate(
  node_netstat_Tcp_RetransSegs{
    instance="$node",
    job="$job"
  }[$__rate_interval]
)
The same panel can therefore be reused for multiple Node Exporter hosts.
Grafana also uses:
$__rate_intervalto calculate an appropriate rate interval based on the selected dashboard time range.
CPU Usage
A typical Linux CPU query is:
100 - (
  avg by(instance) (
    rate(
      node_cpu_seconds_total{
        mode="idle"
      }[5m]
    )
  ) * 100
)
This calculates utilisation by subtracting idle CPU time from 100%.
CPU Core Count
The NetherRealm dashboard also displays the number of CPU cores:
count(
  count(
    node_cpu_seconds_total{
      instance="192.168.68.10:9100"
    }
  ) by (cpu)
)
That gives context to the load shown elsewhere on the dashboard.
Memory Usage
Linux memory monitoring can be deceptively complicated.
Simply displaying:
RAM Used: 80%does not always mean the system is under pressure because Linux aggressively uses spare memory for caching.
NetherRealm therefore breaks memory into areas including:
- application memory
- page tables
- swap cache
- slab
- cached memory
- buffers
- free memory
- swap
- hardware-corrupted memory
The dashboard also goes deeper into:
- committed memory
- anonymous memory
- dirty memory
- writeback
- HugePages
- active and inactive LRU memory
- mapped memory
- locked memory
- kernel memory
- page faults
That is much more useful when investigating genuine memory pressure.
Monitoring Committed Memory
For example, committed memory is tracked with:
node_memory_Committed_AS_bytes{
  instance="$node",
  job="$job"
}
and compared against:
node_memory_CommitLimit_bytes{
  instance="$node",
  job="$job"
}
That provides a much better picture of what the kernel has promised to processes than a simple “used RAM” number.
Disk IOPS
Disk operations are monitored separately for reads and writes.
Read IOPS:
irate(
  node_disk_reads_completed_total{
    instance="$node",
    job="$job",
    device=~"[a-z]+|nvme[0-9]+n[0-9]+|mmcblk[0-9]+"
  }[$__rate_interval]
)
Write IOPS:
irate(
  node_disk_writes_completed_total{
    instance="$node",
    job="$job",
    device=~"[a-z]+|nvme[0-9]+n[0-9]+|mmcblk[0-9]+"
  }[$__rate_interval]
)
NetherRealm displays reads and writes on opposite sides of the graph, which makes activity easier to interpret visually.
Disk Utilisation
IOPS alone does not tell you whether a disk is struggling.
Disk utilisation is calculated using:
irate(
  node_disk_io_time_seconds_total{
    instance="$node",
    job="$job",
    device=~"[a-z]+|nvme[0-9]+n[0-9]+|mmcblk[0-9]+"
  }[$__rate_interval]
)
A disk can show relatively modest IOPS while still spending most of its time busy.
That is why both metrics are useful.
Filesystem Usage
The filesystem-used percentage is calculated with:
(
  (
    node_filesystem_size_bytes{
      instance="$node",
      job="$job",
      device!~"rootfs"
    }
    -
    node_filesystem_avail_bytes{
      instance="$node",
      job="$job",
      device!~"rootfs"
    }
  )
  /
  node_filesystem_size_bytes{
    instance="$node",
    job="$job",
    device!~"rootfs"
  }
) * 100
This makes it easy to see which mount points are approaching capacity.
The dashboard also monitors inode availability, which is useful because a filesystem can technically still have free space while running out of file nodes.
TCP Monitoring
NetherRealm contains a detailed TCP errors panel.
It monitors:
- listen overflows
- listen drops
- SYN retransmissions
- segment retransmissions
- receive errors
- reset packets
- receive queue drops
- out-of-order packets
- TCP timeouts
For example:
irate(
  node_netstat_Tcp_RetransSegs{
    instance="$node",
    job="$job"
  }[$__rate_interval]
)
tracks TCP segment retransmissions.
That is far more useful when diagnosing connectivity issues than simply knowing that the network interface is online.
Network Errors
The dashboard also monitors interface-level problems.
Receive errors:
rate(
  node_network_receive_errs_total{
    instance="$node",
    job="$job"
  }[$__rate_interval]
)
Transmit errors:
rate(
  node_network_transmit_errs_total{
    instance="$node",
    job="$job"
  }[$__rate_interval]
)
There are separate panels for:
- dropped packets
- FIFO errors
- frame errors
- carrier errors
- collisions
- multicast traffic
That makes it easier to distinguish a network-performance problem from a server-performance problem.
Hardware Temperatures
Node Exporter can expose Linux hardware sensor data.
NetherRealm uses:
node_hwmon_temp_celsius{
  instance="$node",
  job="$job"
}
and combines it with chip-name information.
The dashboard also includes critical temperature values reported by the hardware itself.
That means the graph can display the current sensor temperature alongside the system’s own critical thresholds.
Monitoring Node Exporter Itself
I also wanted to know whether Node Exporter was actually collecting all of its metrics successfully.
NetherRealm checks:
node_scrape_collector_success{
  instance="$node",
  job="$job"
}
and:
1 - node_textfile_scrape_error{
  instance="$node",
  job="$job"
}
That prevents a situation where a graph simply stops updating and looks healthy because the last value is still being displayed.
Scrape Performance
There is also a panel showing how long each Node Exporter collector takes:
node_scrape_collector_duration_seconds{
  instance="$node",
  job="$job"
}
That can help identify a slow or failing collector.
Time Synchronisation
Time drift can cause some surprisingly strange problems in infrastructure.
The dashboard monitors:
node_timex_sync_status{
  instance="$node",
  job="$job"
}
alongside the system’s frequency adjustments.
That provides visibility into whether the host clock is still synchronised correctly.
Dashboard Screenshot
I use the existing Realm Labs monitoring screenshot in the article here.
A suitable caption would be:
Realm Labs monitoring dashboard combining Proxmox, Synology, Windows, network-switch and Home Assistant metrics in Grafana.
The dashboard image itself shows the approach well: switch-port status, Proxmox CPU/RAM/swap, Seido storage and temperatures, network traffic and system-temperature summaries all appear in one operational view.
Monitoring the Whole Environment
The finished architecture is therefore closer to this:
             Linux / Proxmox
                    |
              Node Exporter
                    |
                    |
Windows ------------+
Windows Exporter    |
                    |
HP Switch ----------+
SNMP Exporter       |
                    |
Home Assistant -----+
/api/prometheus     |
                    |
Custom Exporters ---+
                    |
                    v
                Prometheus
                    |
                    v
                  Grafana
                    |
                    v
                NetherRealm
That is the real value of the system.
Different platforms can expose their data in different ways, but once everything reaches Prometheus, Grafana can treat it as one monitoring environment.
Prometheus and Grafana Versus Home Assistant
I use both systems, but for different purposes.
Home Assistant is better for:
- quick status
- controls
- automations
- notifications
- mixed smart-home and infrastructure views
Prometheus and Grafana are better for:
- historical analysis
- detailed metrics
- trends
- PromQL
- troubleshooting
- infrastructure dashboards
They complement each other rather than compete.
Why Central Monitoring Matters
As Realm Labs has grown, the value of monitoring has shifted.
Originally, monitoring answered:
Is this server running?Now it can answer:
Is the disk saturated?

Is memory pressure increasing?

Are TCP retransmits rising?

Is the NAS running out of storage?

Is Node Exporter failing a collector?

Is the switch reporting errors?

Is the system overheating?

Did a problem start before or after a configuration change?
That is much more useful.
What I Have Learned
The biggest lesson is that monitoring becomes more useful when it connects systems together.
A single CPU graph is useful.
CPU, memory, disk I/O, network errors, temperatures, storage capacity and exporter health across the entire environment are much more useful.
Prometheus provides the common metrics layer.
Exporters bridge systems that were never designed for Prometheus.
Home Assistant contributes data from devices that already exist there.
Grafana brings the whole thing together.
The Result
Prometheus and Grafana now provide the deeper monitoring layer for Realm Labs.
Prometheus collects metrics from Linux, Proxmox, Windows, Home Assistant, network switches and custom services.
Grafana turns those metrics into the NetherRealm dashboard.
Home Assistant provides selected operational metrics and automation.
Together, they give me one place to understand what the lab is doing rather than opening a different management interface for every device.
More importantly, the monitoring configuration is documented and repeatable.
If the monitoring stack ever needs rebuilding, it is not just a collection of mystery settings hidden inside Grafana.
The Prometheus configuration, exporters and PromQL queries all describe how the environment fits together.