
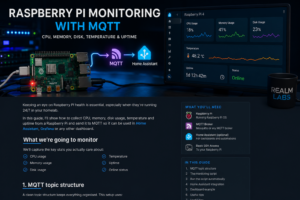

Raspberry Pi MQTT monitoring is a simple way to bring useful system health data into Home Assistant without installing a full monitoring platform on every device.
In Realm Labs, Raspberry Pi systems often sit in the background running automation, scripts, GPIO tasks and other small services. They can run quietly for weeks or months, which is great until one overheats, fills its storage or simply disappears from the network.
Rather than waiting for that to happen, I use MQTT to publish a small set of health metrics from the Pi into Home Assistant.
The result is a lightweight monitoring setup that gives me visibility of CPU usage, memory, disk space, temperature and uptime alongside the rest of the smart-home and homelab environment.
Why Use MQTT for Raspberry Pi Monitoring?
MQTT was already being used throughout Realm Labs, so it made sense to use the same messaging layer for system health data.
It is lightweight, easy to script and integrates well with Home Assistant.
The basic flow is:
Raspberry Pi
    |
    | Collect system statistics
    v
Python script
    |
    | Publish JSON
    v
MQTT broker
    |
    v
Home Assistant
Instead of installing a large monitoring agent, the Pi can simply publish a compact JSON message every few minutes.
For example:
{
  "cpu_usage": 12.4,
  "memory_usage": 38.7,
  "disk_usage": 46.2,
  "cpu_temp": 51.8,
  "uptime": 345600
}
Home Assistant can then turn each value into its own sensor.
What I Wanted to Monitor
For a Raspberry Pi running unattended, I wanted the important health values without turning it into a full infrastructure-monitoring project.
The main values are:
- CPU usage
- memory usage
- disk usage
- CPU temperature
- uptime
These are normally enough to tell me whether the Pi is healthy or whether something deserves attention.
Installing the Python Dependencies
The monitoring script uses two Python libraries:
psutil
paho-mqtt
They can be installed using pip where appropriate:
pip3 install psutil paho-mqttOn newer Debian-based Raspberry Pi OS installations, using distribution packages or a Python virtual environment may be preferable.
The important part is that Python can successfully import both libraries before continuing.
Reading CPU Usage
The psutil library makes gathering CPU usage straightforward:
import psutil

cpu = psutil.cpu_percent(interval=1)
This returns a percentage such as:
12.4A short CPU spike is not necessarily a problem, so I mainly use this value for general visibility rather than immediate alerting.
Reading Memory Usage
Memory usage is similarly simple:
memory = psutil.virtual_memory().percentFor example:
38.7This becomes particularly useful if memory remains high for extended periods or the Pi begins swapping heavily.
Reading Disk Usage
For the main filesystem:
disk = psutil.disk_usage('/').percentThis returns the percentage of storage currently in use.
Disk monitoring is especially useful on Raspberry Pi systems because many still run from relatively small SD cards or SSDs.
A full root filesystem can cause all sorts of problems, including:
- failed logs
- broken package updates
- database issues
- Docker problems
- services stopping unexpectedly
Knowing about it before the filesystem reaches 100% is considerably easier than repairing the mess afterwards.
Reading Raspberry Pi Temperature
The Raspberry Pi exposes CPU temperature through the Linux filesystem.
A simple way to read it is:
with open('/sys/class/thermal/thermal_zone0/temp', 'r') as f:
    temp = int(f.read()) / 1000
The raw value might look like:
51800which becomes:
51.8 °CTemperature is one of the values I particularly like having visible because a Pi can continue working while running hotter than expected.
Reading Uptime
Uptime is useful for showing how long the Pi has been running since its last reboot.
Using psutil:
import time
import psutil

uptime = int(time.time() - psutil.boot_time())
This returns the uptime in seconds.
Home Assistant can then display or process that value as required.
Creating the MQTT Payload
Once the metrics are collected, they can be placed into a Python dictionary:
data = {
    "cpu_usage": cpu,
    "memory_usage": memory,
    "disk_usage": disk,
    "cpu_temp": temp,
    "uptime": uptime
}
Then converted to JSON:
import json

payload = json.dumps(data)
One MQTT message can therefore update several Home Assistant sensors at the same time.
Using a Device-Specific MQTT Topic
If you only have one Raspberry Pi, a topic such as this is enough:
pi/statusHowever, once several devices exist, it makes more sense to use a separate topic for each Pi.
For example:
pi/noobsaibot/stats
pi/tardis/stats
pi/garage/stats
That keeps each device clearly separated while still using the same payload structure.
The hostname can also be retrieved automatically:
import socket

hostname = socket.gethostname()
TOPIC = f"pi/{hostname}/stats"
This means the same script can be reused across several Raspberry Pis without manually changing the MQTT topic every time.
Publishing the Data to MQTT
Using paho-mqtt, the Pi can publish the payload to the broker.
A basic example is:
import paho.mqtt.client as mqtt

BROKER = "192.168.68.20"
PORT = 1883

client = mqtt.Client()
client.connect(BROKER, PORT, 60)
client.publish(TOPIC, payload)
client.disconnect()
Replace the broker address with the address of your own MQTT broker.
Complete Raspberry Pi Monitoring Script
Putting everything together gives us a simple monitoring script:
import json
import time
import socket
import psutil
import paho.mqtt.client as mqtt

BROKER = "192.168.68.20"
PORT = 1883

hostname = socket.gethostname()
TOPIC = f"pi/{hostname}/stats"

cpu = psutil.cpu_percent(interval=1)
memory = psutil.virtual_memory().percent
disk = psutil.disk_usage('/').percent
uptime = int(time.time() - psutil.boot_time())

with open('/sys/class/thermal/thermal_zone0/temp', 'r') as f:
    temp = int(f.read()) / 1000

data = {
    "hostname": hostname,
    "cpu_usage": cpu,
    "memory_usage": memory,
    "disk_usage": disk,
    "cpu_temp": temp,
    "uptime": uptime
}

payload = json.dumps(data)

client = mqtt.Client()
client.connect(BROKER, PORT, 60)
client.publish(TOPIC, payload)
client.disconnect()
Save the script as something like:
mqtt_pi_stats.pyThen test it manually:
python3 mqtt_pi_stats.pyIf the broker is reachable, the MQTT message should be published immediately.
Test MQTT Before Configuring Home Assistant
Before changing anything in Home Assistant, I like to prove that the MQTT side is working first.
From another machine with the Mosquitto client tools installed:
mosquitto_sub \
  -h 192.168.68.20 \
  -t 'pi/#' \
  -v
Then run the Python script again.
You should see something similar to:
pi/noobsaibot/stats {"hostname": "noobsaibot", "cpu_usage": 8.2, "memory_usage": 39.1, "disk_usage": 44.5, "cpu_temp": 49.7, "uptime": 345600}At that point I know:
Python script     working
MQTT publishing  working
Broker            working
That makes any remaining problem much easier to isolate.
Creating Home Assistant MQTT Sensors
Home Assistant can subscribe to the JSON message and extract each value individually.
A YAML configuration can look like this:
mqtt:
  sensor:
    - name: "NoobSaibot CPU Usage"
      state_topic: "pi/noobsaibot/stats"
      value_template: "{{ value_json.cpu_usage }}"
      unit_of_measurement: "%"

    - name: "NoobSaibot Memory Usage"
      state_topic: "pi/noobsaibot/stats"
      value_template: "{{ value_json.memory_usage }}"
      unit_of_measurement: "%"

    - name: "NoobSaibot Disk Usage"
      state_topic: "pi/noobsaibot/stats"
      value_template: "{{ value_json.disk_usage }}"
      unit_of_measurement: "%"

    - name: "NoobSaibot CPU Temperature"
      state_topic: "pi/noobsaibot/stats"
      value_template: "{{ value_json.cpu_temp }}"
      unit_of_measurement: "°C"
      device_class: temperature

    - name: "NoobSaibot Uptime"
      state_topic: "pi/noobsaibot/stats"
      value_template: "{{ value_json.uptime }}"
      unit_of_measurement: "s"
The important part is the template.
For example:
{{ value_json.cpu_usage }}tells Home Assistant to take only the cpu_usage value from the incoming JSON message.
Why I Use One MQTT Topic
It would be perfectly possible to publish several separate topics:
pi/noobsaibot/cpu
pi/noobsaibot/memory
pi/noobsaibot/disk
pi/noobsaibot/temp
That works, but for a simple health update I prefer one JSON message:
1 MQTT message
5 or more values
It keeps measurements from the same polling cycle together and makes the Pi-side script easier to maintain.
Running the Script Automatically
A monitoring script is not very useful if it needs to be run manually.
For a simple setup, cron is enough.
Open the user crontab:
crontab -eThen add:
*/5 * * * * /usr/bin/python3 /home/pi/scripts/mqtt_pi_stats.pyThat runs the script every five minutes.
Why Five Minutes Is Usually Enough
For values such as:
- disk usage
- memory usage
- temperature
- uptime
there is normally little benefit in sending updates every few seconds.
Five minutes is frequent enough to see useful trends without filling Home Assistant history with unnecessary data.
For faster-moving workloads, the interval can always be reduced later.
Using systemd Instead of Cron
For systems where the monitoring process is more important, systemd is another option.
The Python script can run continuously:
while True:
    publish_stats()
    time.sleep(300)
A systemd service can then keep it running and restart it if necessary.
Cron remains perfectly adequate for a lightweight health publisher, but systemd gives better control over logging and service recovery.
Adding Availability Monitoring
One useful improvement is telling Home Assistant whether the Raspberry Pi itself is actually online.
Without this, a sensor can stop updating while still showing its last known value.
A separate availability topic could be:
pi/noobsaibot/availabilityWhen the monitoring service starts, publish:
onlineIf the Pi disconnects unexpectedly, MQTT Last Will can publish:
offlineThis makes it possible to distinguish between:
Temperature hasn't changedand:
The Raspberry Pi has disappeared from the networkMQTT Last Will
MQTT Last Will is particularly useful for unattended devices.
Conceptually:
Pi connects
    |
    +--> publish online

Pi disappears unexpectedly
    |
    +--> broker publishes offline
The broker handles the failure notification even though the Raspberry Pi is no longer able to send messages itself.
Building a Home Assistant Dashboard
Once the sensors exist, they can be added to a normal Home Assistant dashboard.
A simple card might show:
NoobSaibot

CPU          12%
Memory       39%
Disk         46%
Temperature  52°C
Uptime       4 days
Status       Online
This is where the project becomes genuinely useful.
The Pi stops being an invisible Linux device and becomes part of the same operational view as the rest of the environment.
Temperature Alerts
Temperature is a good candidate for alerting.
For example:
Raspberry Pi temperature > 75°Ccould trigger a Home Assistant notification.
That provides warning before sustained heat becomes a larger problem.
Disk Space Alerts
Disk usage is another value worth watching.
For example:
Disk usage > 85%can trigger a notification before the filesystem becomes critically full.
On systems running databases, Docker or heavy logging, this can prevent a lot of avoidable troubleshooting.
CPU Alerts Need More Context
CPU usage is slightly different.
A Raspberry Pi reaching 100% for a few seconds may be completely normal.
I would not trigger an alert from one high reading.
Something like:
CPU usage > 90%
for 10 minutes
is much more useful because it represents sustained load rather than a short spike.
When MQTT Is Enough
This setup works particularly well when I only want a few useful values inside Home Assistant.
It is lightweight and easy to understand.
For example:
- Pi temperature
- CPU usage
- memory usage
- disk usage
- uptime
- online/offline state
That covers most of what I need for small utility devices.
When Prometheus Is Better
Realm Labs also uses Prometheus and Grafana for more detailed infrastructure monitoring.
That is a better fit when I need:
- many metrics
- detailed historical data
- higher-resolution sampling
- PromQL queries
- larger dashboards
- long-term trends
MQTT and Prometheus are not really competing approaches.
For me, MQTT is ideal for getting a handful of useful values into Home Assistant, while Prometheus is better for deeper infrastructure monitoring.
Home Assistant as an Operations Dashboard
This project is also a good example of how Home Assistant has evolved inside Realm Labs.
It is no longer only used for:
Lights
Heating
Smart plugs
Sensors
It can also display:
Raspberry Pi health
NAS status
Virtual machine metrics
Network information
Docker host data
Internet status
That makes it useful as a lightweight operations dashboard as well as a smart-home platform.
Troubleshooting
If Home Assistant is not receiving data, I work through the chain from the source.
Run the Python Script Manually
python3 mqtt_pi_stats.pyFix any Python errors before doing anything else.
Subscribe to the MQTT Topic
mosquitto_sub \
  -h 192.168.68.20 \
  -t 'pi/#' \
  -v
If the expected message never appears, the problem is on the Raspberry Pi or MQTT broker side.
Check the JSON
Make sure the published data is valid JSON and that the field names match the Home Assistant templates.
For example, if the payload contains:
{
  "cpu_usage": 12.4
}
then this will not work:
{{ value_json.cpu }}The template must be:
{{ value_json.cpu_usage }}Check the MQTT Topic
The topic must also match exactly.
These are different:
pi/status
pi/noobsaibot/stats
A mismatch here is easy to overlook.
The Result
Raspberry Pi MQTT monitoring gives me a lightweight way to keep an eye on devices that would otherwise disappear into the background.
Each Pi can publish a small JSON payload containing the important values, and Home Assistant can turn those values into sensors, dashboards and alerts.
The setup is simple enough to run on small devices, scales easily to multiple Raspberry Pis and works alongside more advanced tools such as Prometheus and Grafana.
For Realm Labs, that makes it a useful middle ground between having no monitoring at all and deploying a full monitoring stack to every small device.