
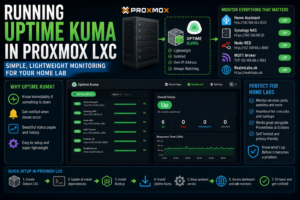

As Realm Labs grew, I already had Prometheus and Grafana giving me detailed metrics about the infrastructure.
CPU load.
Memory.
Storage.
Network interfaces.
Service performance.
That was useful, but it answered a very specific question:
How is the system performing?
What I also wanted was something simpler.
Is it actually up?
That’s where Uptime Kuma fitted in.
Rather than adding it to another Docker stack, I decided to run it in a lightweight Proxmox LXC so it had its own small place in the lab and could monitor everything else independently.
Why Uptime Kuma?
Prometheus and Grafana are excellent for metrics.
But sometimes I don’t need a graph.
I just want to know whether:
Home Assistant is reachable
Portainer is responding
Synology is online
Node-RED is up
MQTT is listening
A website is available
A server responds to ping
Uptime Kuma is perfect for that.
Its job is essentially:
Check service
    |
    v
Is it alive?
    |
    +--> Yes
    |
    +--> No
Simple.
And sometimes simple is exactly what you want.
The Existing Monitoring Setup
By this point, Realm Labs already had a more detailed monitoring stack.
Conceptually:
Devices
   |
   v
Prometheus
   |
   v
Grafana
That gave me dashboards and historical metrics.
Uptime Kuma added another layer:
Devices / Services
        |
        +--> Prometheus / Grafana
        |       Detailed metrics
        |
        +--> Uptime Kuma
                Availability
The two systems solve different problems.
Why I Didn’t Just Run It in Docker
I could easily have deployed Uptime Kuma in Docker.
In fact, that’s probably the most common way to run it.
But I liked the idea of keeping the monitoring system slightly separated from the services it was monitoring.
If the Docker host itself had a problem, I still wanted the monitoring service to remain available if possible.
So I used Proxmox.
Why an LXC Was a Good Fit
Uptime Kuma doesn’t need much.
A full virtual machine would have been overkill.
A small LXC container provides:
- Its own IP address
- Very little resource usage
- Simple backups
- Easy startup and shutdown
- Isolation from other applications
- Fast deployment
The architecture became:
Proxmox
   |
   v
Uptime Kuma LXC
   |
   +--> Home Assistant
   +--> Synology
   +--> Portainer
   +--> Node-RED
   +--> MQTT
   +--> Websites
That was exactly what I wanted.
Creating the LXC
Inside Proxmox, I created a new Debian-based LXC.
The exact resource allocation doesn’t need to be huge.
Something along the lines of:
CPU: 1-2 cores
RAM: 512 MB - 1 GB
Disk: 8 GB
is more than enough for a small home lab.
I also gave it a fixed IP address so I always knew where the monitoring dashboard lived.
For example:
192.168.68.x
The exact address doesn’t matter as much as keeping it consistent.
Update the Container
After creating the LXC:
apt update
apt upgrade -y
Then install the basic tools needed.
For example:
apt install curl git -y
Installing Node.js
Uptime Kuma runs on Node.js.
The important part is using a supported Node.js release rather than whatever ancient version happens to be in the default repository.
After installing Node.js, confirm:
node -v
and:
npm -v
If both return sensible versions, you’re ready to install Kuma.
Installing Uptime Kuma
I created a suitable application directory and cloned the project.
For example:
cd /opt
git clone https://github.com/louislam/uptime-kuma.git
cd uptime-kuma
Then install the dependencies:
npm run setup
Once complete, Uptime Kuma can be started with:
node server/server.js
By default, the interface is normally available on port:
3001
So from another machine:
http://<uptime-kuma-ip>:3001
should open the setup page.
Making It Start Automatically
Running it manually is fine for testing.
But I wanted the service to survive reboots.
A systemd service is a clean way to do that.
For example:
[Unit]
Description=Uptime Kuma
After=network.target

[Service]
Type=simple
User=root
WorkingDirectory=/opt/uptime-kuma
ExecStart=/usr/bin/node /opt/uptime-kuma/server/server.js
Restart=always

[Install]
WantedBy=multi-user.target
Save that as:
/etc/systemd/system/uptime-kuma.service
Then:
systemctl daemon-reload
systemctl enable uptime-kuma
systemctl start uptime-kuma
Check:
systemctl status uptime-kuma
At that point the monitoring system starts automatically with the LXC.
Adding the First Monitor
Once logged into the dashboard, the next step was adding actual services.
The simplest monitor is a ping check.
For example:
Synology
192.168.68.20
Uptime Kuma periodically checks whether the host responds.
That gives a very simple:
UP
or:
DOWN
status.
Monitoring Web Services
For services with a web interface, HTTP checks are more useful.
For example:
Home Assistant
http://192.168.68.x:8123
or:
Portainer
https://192.168.68.x:9443
or:
Node-RED
http://192.168.68.x:1880
This doesn’t just prove the host is alive.
It proves the actual service is responding.
That’s a much better test.
Why Ping Alone Isn’t Enough
A server can answer ping while an application is completely broken.
For example:
Server responds to ICMP
        |
        v
Machine is online
But:
Home Assistant service crashed
So for important services, I prefer checking the service itself.
That gives:
Host availability
+
Application availability
rather than assuming one means the other.
Monitoring My Public Realm Labs Site
Uptime Kuma is also useful for checking public services.
For example:
https://realmlabs.uk
That means I can detect whether:
- The website is reachable
- Cloudflare routing is working
- WordPress is responding
- HTTPS is functioning
This is particularly useful because the monitoring request travels through the same public route as a normal visitor.
Monitoring Cloudflare-Tunnelled Services
Some Realm Labs services are published through Cloudflare Tunnel.
That creates two possible checks.
Internal check
http://192.168.68.x:port
External check
https://service.realmlabs.uk
This gives useful diagnostic information.
If the internal check works but the public check fails:
Application healthy
Cloudflare/public path broken
If both fail:
Application itself may be down
That distinction is extremely useful.
Monitoring MQTT
MQTT doesn’t provide a normal HTTP page.
Uptime Kuma can still monitor TCP ports.
For Mosquitto:
Port: 1883
That checks whether something is listening.
It doesn’t prove the entire MQTT workflow is healthy, but it does tell me whether the broker is reachable.
The same approach works for other services.
TCP Monitoring
Useful examples include:
SSH
Port 22
MQTT
Port 1883
HTTPS
Port 443
RDP
Port 3389
This makes Uptime Kuma useful beyond websites.
Monitoring Proxmox
For Proxmox itself, I can monitor the management interface.
For example:
https://192.168.68.x:8006
That tells me whether the Proxmox UI is alive.
I can then separately monitor important guests.
The hierarchy becomes:
Proxmox Host
    |
    +-- Pi-hole
    +-- Uptime Kuma
    +-- Other VMs / LXCs
If several guests go offline at the same time, the host becomes an obvious suspect.
Monitoring Synology
The Synology is a particularly important system because so many Realm Labs services depend on it.
I can monitor:
Ping
and perhaps:
DSM HTTPS
and selected services.
That makes it easier to distinguish:
NAS offline
from:
One NAS service down
Grouping Monitors
Once you have more than a handful of checks, organisation matters.
I found it useful to group systems by function.
For example:
Core Infrastructure
with:
- Router
- Synology
- Proxmox
- DNS
Then:
Home Automation
with:
- Home Assistant
- Node-RED
- MQTT
Then:
Public Services
with:
- realmlabs.uk
- Portainer hostname
- Leaderboard
- Other published services
This makes the dashboard much easier to read.
Status Pages
One of Uptime Kuma’s nicest features is the ability to create a status page.
That can show selected monitors in a clean read-only view.
For a home lab, that might seem excessive.
But it’s actually useful as a quick dashboard.
Something like:
Realm Labs Status

Core Network      Operational
Home Assistant    Operational
MQTT              Operational
Website           Operational
Synology          Operational
It gives you an immediate health overview.
Notifications
Monitoring isn’t very useful if you have to constantly stare at the dashboard.
Uptime Kuma supports notifications through multiple services.
The exact integration depends on what you use, but the important idea is:
Monitor detects failure
        |
        v
Notification sent
That means I can find out about a failed service before I happen to notice it manually.
Avoid Alert Fatigue
One thing I learned quickly is not to monitor everything too aggressively.
If every tiny transient timeout creates an alert, you stop paying attention.
For example, rather than checking every few seconds, it can be better to use sensible intervals and retries.
The goal is:
Tell me when something is actually broken.
Not:
Tell me every time a Wi-Fi device misses one packet.
Use Retries
Retries are especially useful for services that may occasionally respond slowly.
Instead of:
One failed check
=
DOWN
use something closer to:
Several consecutive failures
=
DOWN
That makes the monitoring much more useful.
Heartbeat Monitors
Uptime Kuma can also work the other way around.
Instead of Kuma polling a service, a script can periodically contact Kuma.
This is useful for jobs such as:
- Backups
- Cron jobs
- Scheduled scripts
- Maintenance tasks
For example:
Backup runs
    |
    v
Calls heartbeat URL
If Kuma stops receiving the heartbeat, the job may have failed.
This is very different from simply checking whether a server is online.
Monitoring Backups
This gave me another idea for Realm Labs.
Rather than only asking:
Is Synology online?
I can also ask:
Did the backup job actually run?
That is a much more meaningful form of monitoring.
A server being healthy doesn’t mean its backups are healthy.
Grafana vs Uptime Kuma
I don’t see Uptime Kuma as replacing Grafana.
They answer different questions.
Grafana:
What is happening?
How much CPU?
How much memory?
How much bandwidth?
What happened over time?
Uptime Kuma:
Is it up?
How long has it been up?
When did it fail?
Did it recover?
Together, they’re much stronger.
Example Monitoring Stack
The Realm Labs monitoring architecture can therefore look like:
                    Realm Labs Systems
                            |
             +--------------+--------------+
             |                             |
             v                             v
       Prometheus                      Uptime Kuma
             |                             |
             v                             v
          Grafana                    Availability
             |
             v
      Detailed Metrics
One gives depth.
The other gives clarity.
Why Running Kuma Separately Helps
Putting Uptime Kuma in its own LXC gives it a degree of independence.
For example, if Docker on the Synology breaks:
Synology Docker
      X
Uptime Kuma can still tell me that the services disappeared.
If Uptime Kuma itself were hosted inside the same failing Docker environment, I’d lose the monitor at the same time as the monitored service.
That doesn’t make the LXC immune to everything.
But it avoids one obvious shared failure point.
Backing Up the LXC
One of the advantages of Proxmox is that the whole LXC can be backed up.
So rather than manually rebuilding Uptime Kuma if something goes wrong, I can use Proxmox’s normal backup process.
That gives me:
Uptime Kuma
+
Configuration
+
Monitor history
+
Settings
in one manageable guest.
Don’t Monitor by Hostname Until DNS Is Proven
This is a small troubleshooting lesson.
If Uptime Kuma checks:
homeassistant.order.realm
and DNS fails, Kuma will report the service down.
But the application may actually be fine.
For critical infrastructure, it can be useful to monitor both:
IP-based reachability
and:
DNS-based service URL
That helps identify whether:
Service failed
or:
DNS failed
The First Dashboard
Once the initial monitors were configured, I finally had a simple overview of Realm Labs.
Instead of checking individual apps:
Open Home Assistant
Open Synology
Open Portainer
Open Proxmox
Open website
I could open one page.
And immediately see:
Everything green
or:
Something needs attention
That’s surprisingly satisfying.
A Sensible Starting List
If you’re setting up Uptime Kuma in a home lab, I would start small.
Monitor:
- Router
- DNS server
- NAS
- Hypervisor
- Home Assistant
- MQTT
- Important Docker host
- Public website
Once those are reliable, add more.
There is no prize for having hundreds of monitors.
The dashboard should remain useful.
Useful Monitor Types
The monitor type depends on the service.
Ping
Good for:
Router
Switch
NAS
Server
HTTP/HTTPS
Good for:
Home Assistant
Portainer
Websites
Proxmox
Node-RED
TCP Port
Good for:
MQTT
SSH
RDP
Databases
Heartbeat
Good for:
Backups
Cron jobs
Scheduled scripts
The best check is the one that most closely represents what you actually care about.
The Realm Labs Takeaway
Grafana tells me whether a system is busy.
Uptime Kuma tells me whether it’s alive.
That’s why I ended up keeping both.
The final model became:
Prometheus + Grafana
        |
        v
Performance and history

Uptime Kuma
        |
        v
Availability and alerts
Running Kuma in a small Proxmox LXC also keeps the monitoring platform separate from many of the services it watches.
It’s lightweight.
It’s easy to understand.
And when I open the dashboard and see a wall of green status indicators, I know the important parts of Realm Labs are at least responding.
Sometimes that’s all the monitoring you need.