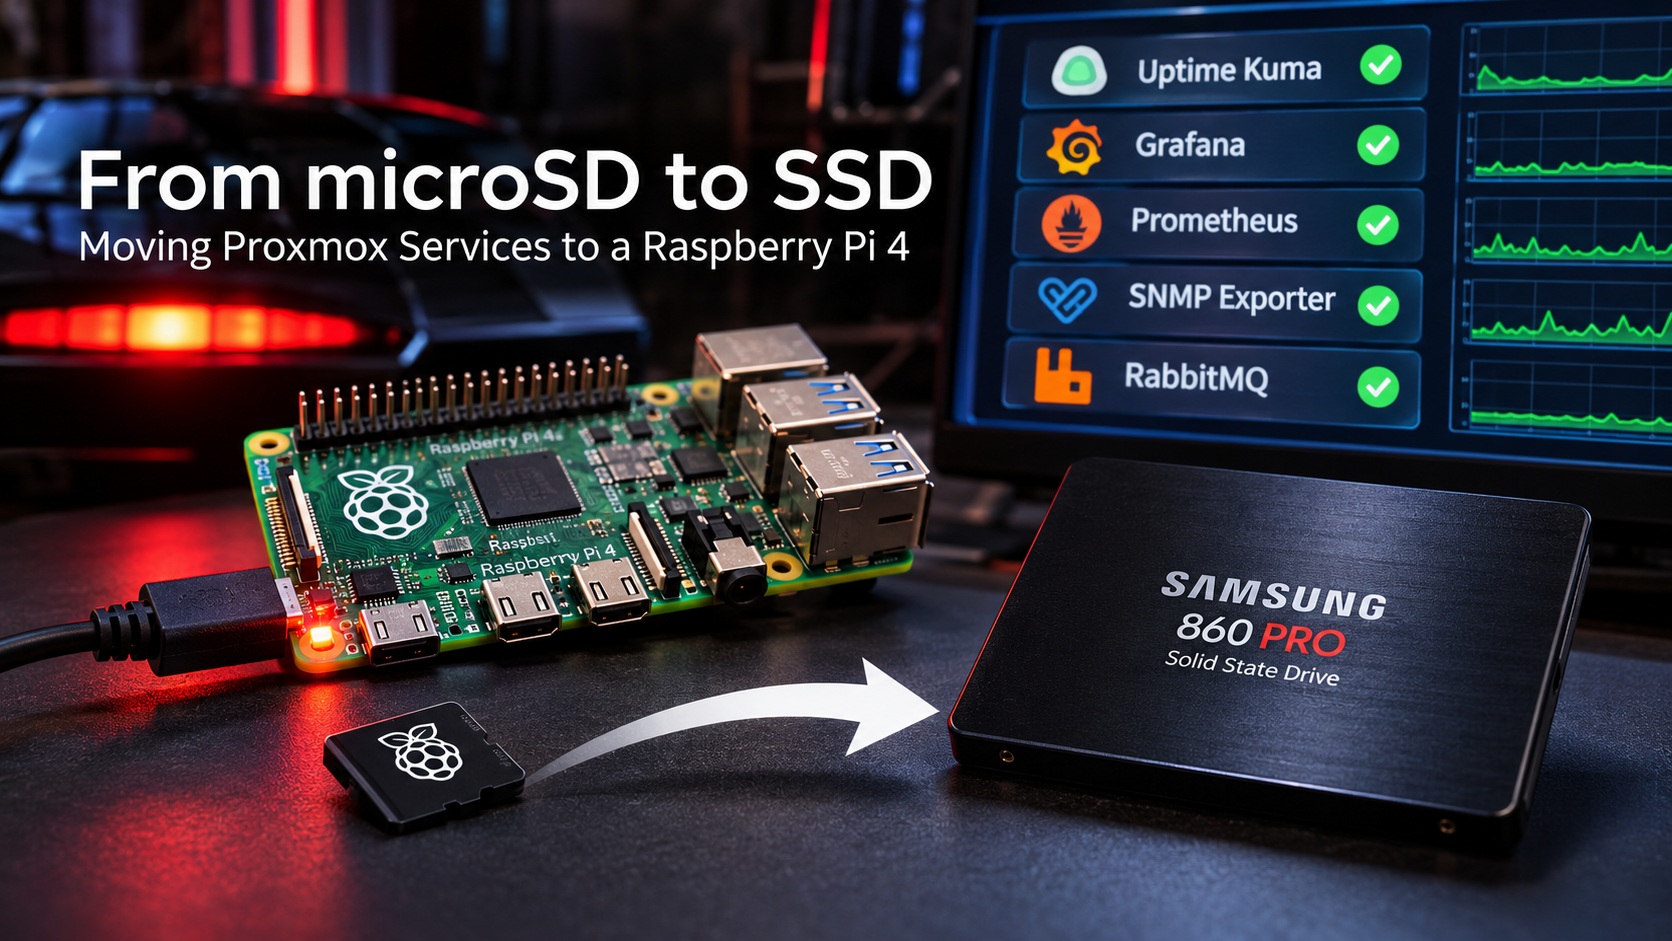

31 October 2026 — RealmLabs homelab project. Tonight I turned an existing Raspberry Pi 4 into an SSD-booted infrastructure host, then moved five workloads off my Proxmox server without rebuilding the dashboards or throwing away monitoring history. It wasn’t entirely smooth: the USB enclosure initially caused boot failures, and RabbitMQ revealed an overlooked Node-RED publisher. Here is what actually worked, what broke, and the verification commands I used.
The goal: keep the essentials online without relying on the Proxmox server
My Intel-based Proxmox machine, QuanChi, has 16 GB RAM and runs heavier services including Ollama-powered KITT-AI and Piper TTS. It was also hosting several lightweight LXCs that really did not need a full x86 virtualisation host around the clock. Its local-lvm storage was already about 98% full.
The plan was to use my existing Raspberry Pi 4, named NoobSaibot, as an always-on Docker host. It already ran Debian 12 Bookworm (ARM64), GPIO automation and some older services. It had 4 GB RAM and was booting from a microSD card. Before adding monitoring and messaging workloads, I wanted to move it to a real SSD.
Hardware and starting point
- Computer: Raspberry Pi 4, 4 GB RAM
- OS: 64-bit Debian 12 Bookworm
- Original storage: 256 GB microSD card
- Replacement: Samsung 860 PRO 256 GB SATA SSD
- Connection: UGREEN USB 3 SATA enclosure, USB ID
174c:235c - Management: Docker and Portainer
- Pi network address in my lab:
192.168.68.30
Part 1 — Migrating the Raspberry Pi from microSD to SSD
1. Identify the drives and copy the existing system
The source installation was running on /dev/mmcblk0; the SSD was detected as /dev/sda. I partitioned and formatted the target SSD, mounted the new boot and root partitions, and copied the running installation using rsync so I could preserve Docker, automation scripts, services and configuration.
lsblk -o NAME,SIZE,FSTYPE,MOUNTPOINTS,PARTUUID
lsusb
A typical file-level copy of a Linux root filesystem uses rsync -aAXH and excludes transient pseudo-filesystems such as /proc, /sys, /dev and /run. The target mountpoints and partition names must be checked on your own machine before copying anything. Blindly copying device identifiers from a blog post is a good way to damage the wrong disk.
2. Point the Pi’s boot configuration at the SSD
After copying the files, I updated the SSD copy of /boot/firmware/cmdline.txt and /etc/fstab to refer to the new SSD partitions by PARTUUID. In my setup, the SSD root partition was /dev/sda2, with the boot partition on /dev/sda1. The Pi’s EEPROM boot order supported USB boot, and I retained the original microSD as a fallback.
findmnt /
findmnt /boot/firmware
lsblk -o NAME,MOUNTPOINTS,PARTUUID
Those three checks matter more than simply seeing the SSD plugged in. They confirm which device the Pi actually booted from.
3. The USB enclosure problem: I/O errors and timeouts
The first SSD boots were not reliable. I encountered USB enumeration failures, -110 timeouts and I/O errors. The issue turned out to be the interaction between this particular USB-to-SATA bridge and Linux’s UAS driver. On the SSD’s /boot/firmware/cmdline.txt, I added:
usb-storage.quirks=174c:235c:uThe 174c:235c value is the USB vendor/product ID reported by lsusb for my enclosure. This option disables UAS for that adapter and uses the traditional usb-storage driver instead. It is a troubleshooting workaround, not a universal Raspberry Pi tuning tip. Test your own adapter before applying it.
After rebooting, the Pi consistently reported the root filesystem on /dev/sda2, the USB link at 5,000 Mbit/s, and the enclosure using usb-storage. A sustained sequential read reached about 263 MB/s without the previous I/O errors. The throttling check returned 0x0 during the test:
vcgencmd get_throttled
lsusb -t
I also replaced an unnecessarily large swapfile with a roughly 2 GB SSD swap configuration. I kept the original microSD card as a rollback copy instead of wiping it immediately.
Reliability caveat: a USB SSD is a substantial practical improvement for this workload, but it is not the same as redundant storage. A proper 5.1 V / 3 A power supply and scheduled backups to a separate system remain essential.
Part 2 — Moving Proxmox workloads into Docker
With SSD boot stable, I migrated the lighter services from QuanChi to NoobSaibot. To minimise variables, the first container deployment used the same service versions as the original LXCs, with persistent Docker bind mounts under /opt.
| Workload | Original LXC | Docker image / version | Pi port |
|---|---|---|---|
| Uptime Kuma | 105 | louislam/uptime-kuma:2.5.5 | 3001 |
| Grafana | 109 | grafana/grafana:13.2.3 | 3000 |
| Prometheus | 111 | prom/prometheus:v3.15.0 | 9090 |
| SNMP Exporter | Alongside Prometheus | prom/snmp-exporter:v0.30.1 | 9116 internally |
| RabbitMQ | 103 | rabbitmq:4.3.6-management | 5672 / 15672 / 15692 |
Uptime Kuma: preserve the SQLite database
I stopped Kuma in LXC 105, archived its /opt/uptime-kuma/data directory, copied it to the Pi’s SSD, and mounted that directory into the Docker image as /app/data.
services:
  uptime-kuma:
    image: louislam/uptime-kuma:2.5.5
    container_name: uptime-kuma
    restart: unless-stopped
    ports:
      - "3001:3001"
    volumes:
      - /opt/uptime-kuma/data:/app/data
    environment:
      - TZ=Europe/London
The existing account, monitors and history appeared after startup. Only then did I disable autostart and stop the old LXC.
Grafana: dashboards, database and ARM64 plugins
For Grafana I backed up its data and configuration from LXC 109, including the SQLite database (grafana.db), and restored them to the Pi. The Grafana container runs as UID/GID 472 with writable persistent data and a read-only config mount.
One cross-architecture gotcha: Grafana plugins that contain native x86 binaries should not simply be copied into an ARM64 container. I removed the old downloaded plugin directory and installed/restored compatible plugins separately. The dashboards and configuration were present when the replacement Grafana started.
Prometheus: migrate the TSDB, not just the YAML
Prometheus had around 840 MB of time-series data in LXC 111. I stopped the service before copying /var/lib/prometheus, restored it under /opt/prometheus/data on the Pi, set appropriate ownership, and carried over the scrape configuration.
Prometheus started, reported healthy data blocks, replayed the write-ahead log (WAL), and loaded its configuration successfully. The SNMP Exporter moved with it. Because Prometheus and the exporter now share a Docker network, exporter scrape endpoints that previously used 127.0.0.1:9116 were changed to snmp-exporter:9116.
sudo docker exec prometheus promtool check config /etc/prometheus/prometheus.ymlThe migration retained historical metrics rather than starting the graph history from zero.
Retention note: the deployment initially used --storage.tsdb.retention.time=15d. I considered raising this to 90 days, but it must be checked and adjusted explicitly in the Portainer stack. SSD capacity alone does not change Prometheus retention.
RabbitMQ: restore definitions, then reconnect publishers and consumers
RabbitMQ was the trickiest service, because it carries live KITT messages. The source, LXC 103, ran RabbitMQ 4.3.6. I exported definitions containing the /kitt vhost, users, exchanges, queues, permissions, bindings and policies, and made a separate cold backup of its internal data directory.
rabbitmqctl export_definitions /tmp/rabbitmq-definitions.json
# Stop RabbitMQ before archiving its internal database
tar -czf /tmp/rabbitmq-data-backup.tar.gz -C /var/lib/rabbitmq mnesia
The Docker instance was deployed with a fresh persistent volume. I imported the definitions rather than blindly copying the old x86 broker’s internal database into a new ARM64 broker. Definition exports do not include queued messages, so these are two distinct backup tasks. Treat RabbitMQ exports as sensitive files because they may contain password hashes and connection information.
I temporarily exposed alternative AMQP and management ports to test the new instance without interrupting the original, then switched the Pi to the standard ports 5672, 15672 and 15692 for cutover.
Part 3 — Lessons from the RabbitMQ cutover
Temporary TTS results are not the same as message history
The source KittTTS.Results queue initially contained 6,419 messages and no consumer. We attempted a temporary RabbitMQ Shovel to move them, but it reported only two forwarded messages and stalled-looking counters. Both brokers had a five-minute TTL policy on that results queue. We did not treat a drained source queue as proof that all 6,419 messages had arrived on the Pi. The original cold backup was retained, and the old results were not blindly replayed into the live system.
The overlooked publisher was using HTTP, not AMQP
The four live KITT/Piper Python scripts were straightforward: back them up, change their RabbitMQ host from the old LXC to the Pi, run Python syntax checks and restart the services. The new broker showed three live connections and consumers on KittTTS, KittEvents and kitt.ha.state_cache.
But the old broker’s Home Assistant state cache kept growing, even though RabbitMQ showed no active AMQP clients. The first packet captures on port 5672 showed nothing. When I included port 15672, the traffic came from Seido, my Synology NAS.
The culprit was a Node-RED Function node publishing Home Assistant state changes via RabbitMQ’s HTTP Management API. Its URL still pointed to the old broker:
http://OLD-BROKER:15672/api/exchanges/%2Fkitt/kitt/publishChanging that URL to the Pi and redeploying the flow stopped the observed growth of the old queue. The key lesson is simple: not every RabbitMQ publisher is an AMQP client. HTTP API traffic can be missed if you only inspect port 5672 or the active AMQP connections list.
Passwords should be kept out of Node-RED function code where possible. Rotate any credential that has been shared during troubleshooting and store it in a protected configuration or credential mechanism.
Monitoring needed updating too
The migrated Prometheus setup still scraped RabbitMQ on the old address. I changed both rabbitmq and rabbitmq_detailed job targets to the Pi’s metrics endpoint, 192.168.68.30:15692, restarted Prometheus and ran promtool check config. Both jobs subsequently reported UP.
Part 4 — Checks and resource usage
At the time of testing, NoobSaibot reported approximately 1.2 GiB used RAM and 2.5 GiB available, with no swap in use. RabbitMQ reported roughly 140 MB of memory usage. All three key RabbitMQ consumers were connected and the two Prometheus RabbitMQ jobs were UP.
QuanChi had around 12 GiB of available RAM after the monitoring workloads were stopped. I set onboot=0 and shut down LXCs 103, 105, 109 and 111, but kept the old container disks intact for rollback.
Stopping LXCs does not immediately recover their allocated storage. Local-lvm was still roughly 98% full during the migration, and deleting those rollback copies would be a separate housekeeping step after backups and additional soak testing.
What stayed on Proxmox?
Not everything belongs on the Pi. Piper / TTSServer (LXC 106) and KITT-AI with Ollama (LXC 108) stayed on QuanChi. The Pi handles monitoring and messaging; QuanChi handles the more CPU-intensive AI and speech workloads. That division also makes it easier to consider powering down the Intel host when heavy workloads are not needed without taking the core monitoring stack offline.
What I would improve next
- Use a known-good Raspberry Pi 5.1 V / 3 A power supply.
- Automate SSD application-data backups to separate Synology storage.
- Confirm or adjust Prometheus retention to suit the disk budget.
- Soak-test the Pi before deleting any old LXC disks.
- Update dashboards, bookmarks and alerts that still reference old Proxmox LXC addresses.
- Review RabbitMQ credentials and verify a real Home Assistant event and TTS request end to end.
The verdict
A Raspberry Pi 4 is not inherently more fault-tolerant than a Proxmox server. It has limited RAM, relies on external USB storage, and lacks redundant power or storage. But with SSD boot configured correctly, compatible Docker images, persistent volumes, backups and sensible workload placement, it makes a capable low-power infrastructure host.
For this homelab, the biggest win was architectural: the monitoring and messaging stack no longer needs the Intel host to run continuously. And the most useful lesson of the evening? Verify the full data path, not just whether a container says “Up”.